Satellite Activity data for better decision making
Improve your confidence with SpaceKnow Nowcasting Datasets and Reports. Get access to data gathered from thousands of locations based on real-time satellite information and precise algorithms.
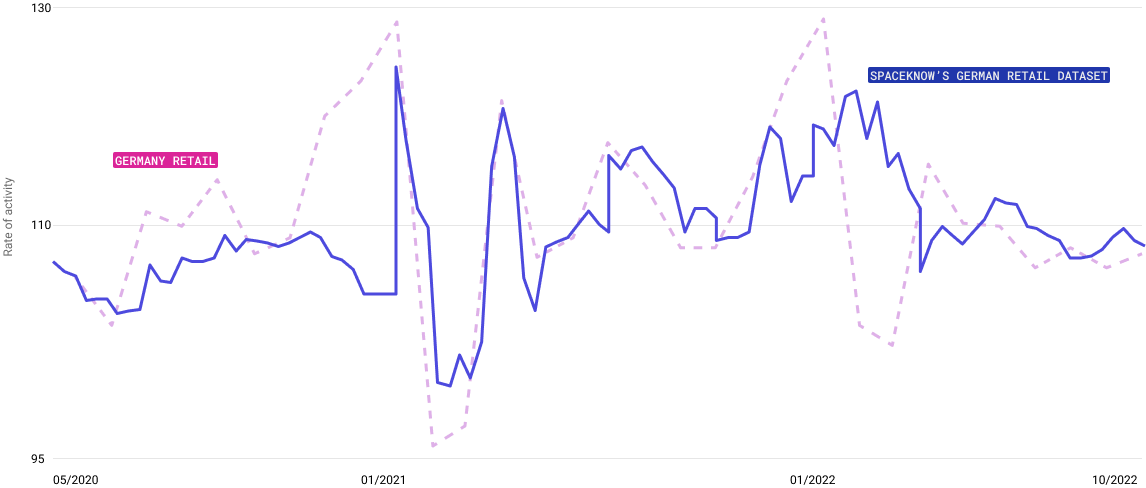
SpaceKnow datasets can help predict future economic developments
Weeks before official retail data is released, our German retail index can provide a snapshot of the retail scene.

Tailored just for you
We provide traders, portfolio managers, corporate strategists, economists and governments a unique view from above. No lengthy image analysis is required. That’s on us.
A wide range of datasets
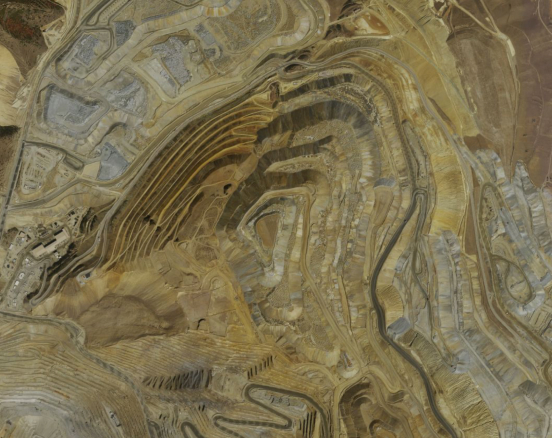
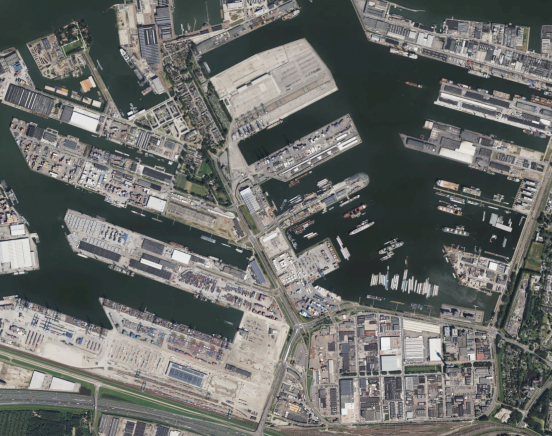
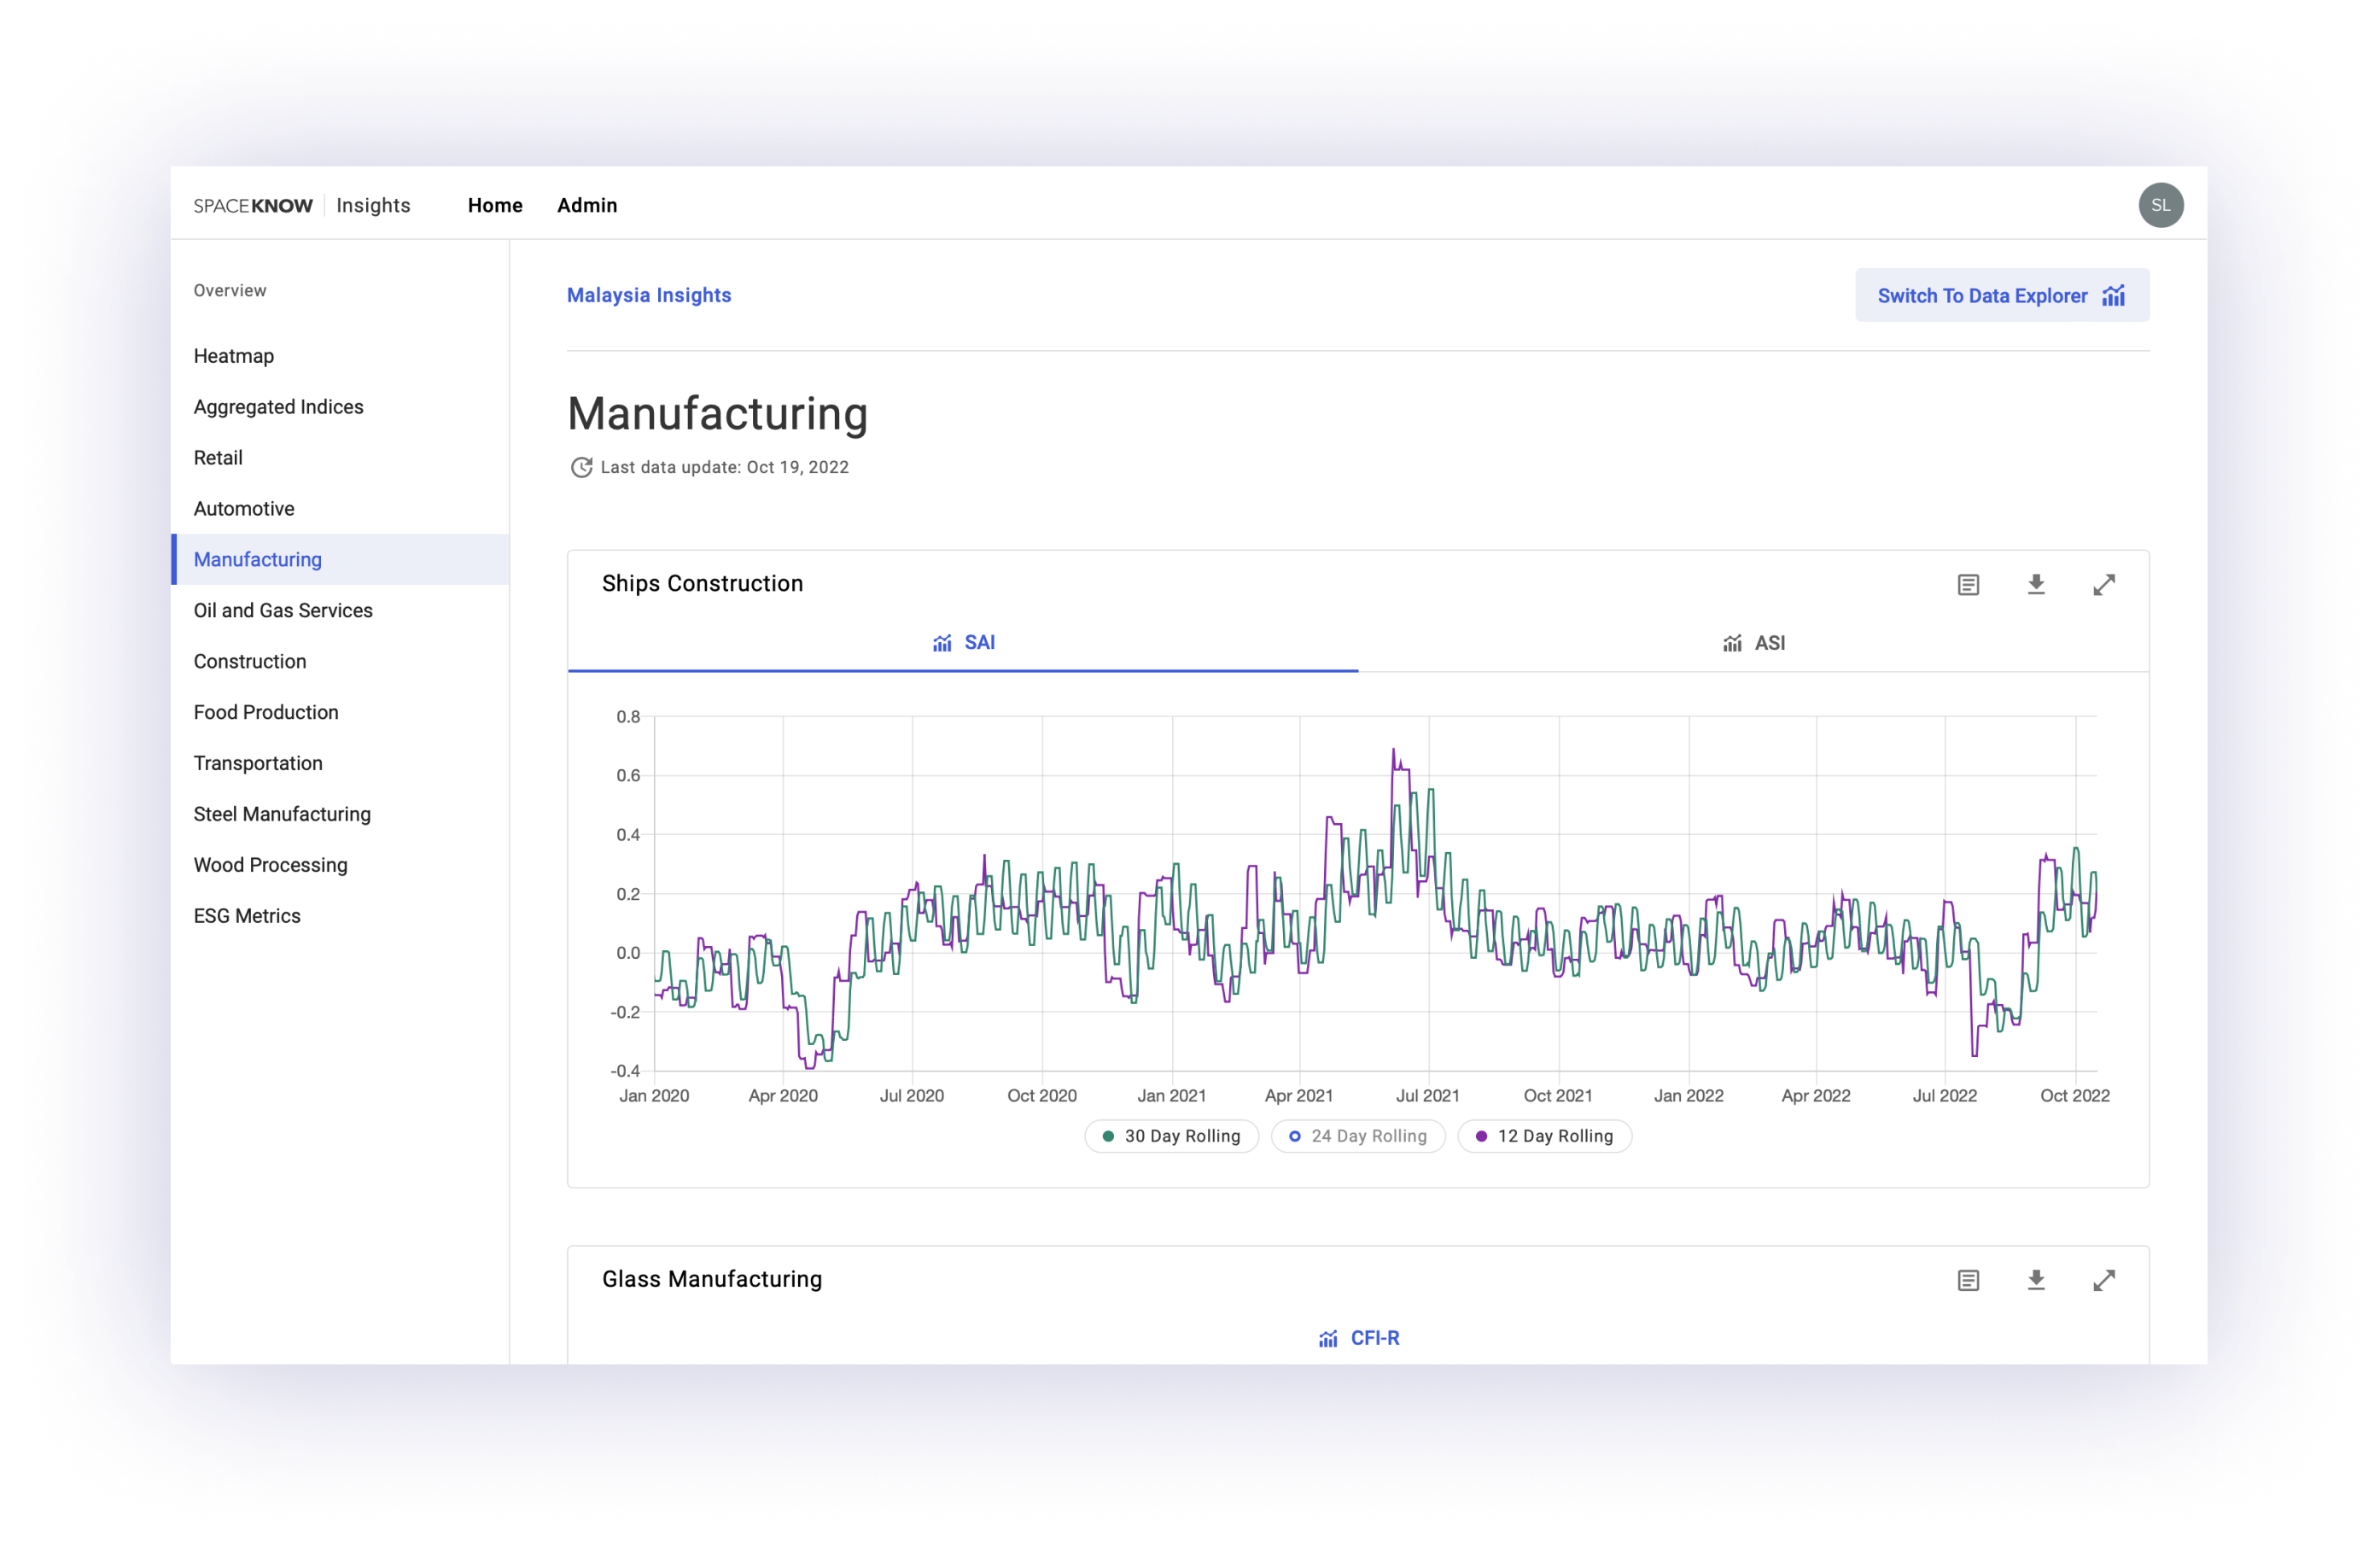
In SpaceKnow’s Nowcasting Datasets, you can find near-real-time activity data for specific industries like mining, retail, manufacturing, transportation and more. Analyzing these signals can provide valuable insight into macroeconomic activity.
Cross-comparable data
Our country datasets allow customers to easily compare national economies using the same measuring sticks, our indices. This allows researchers to overcome the challenge of comparing ‘apples with oranges’.
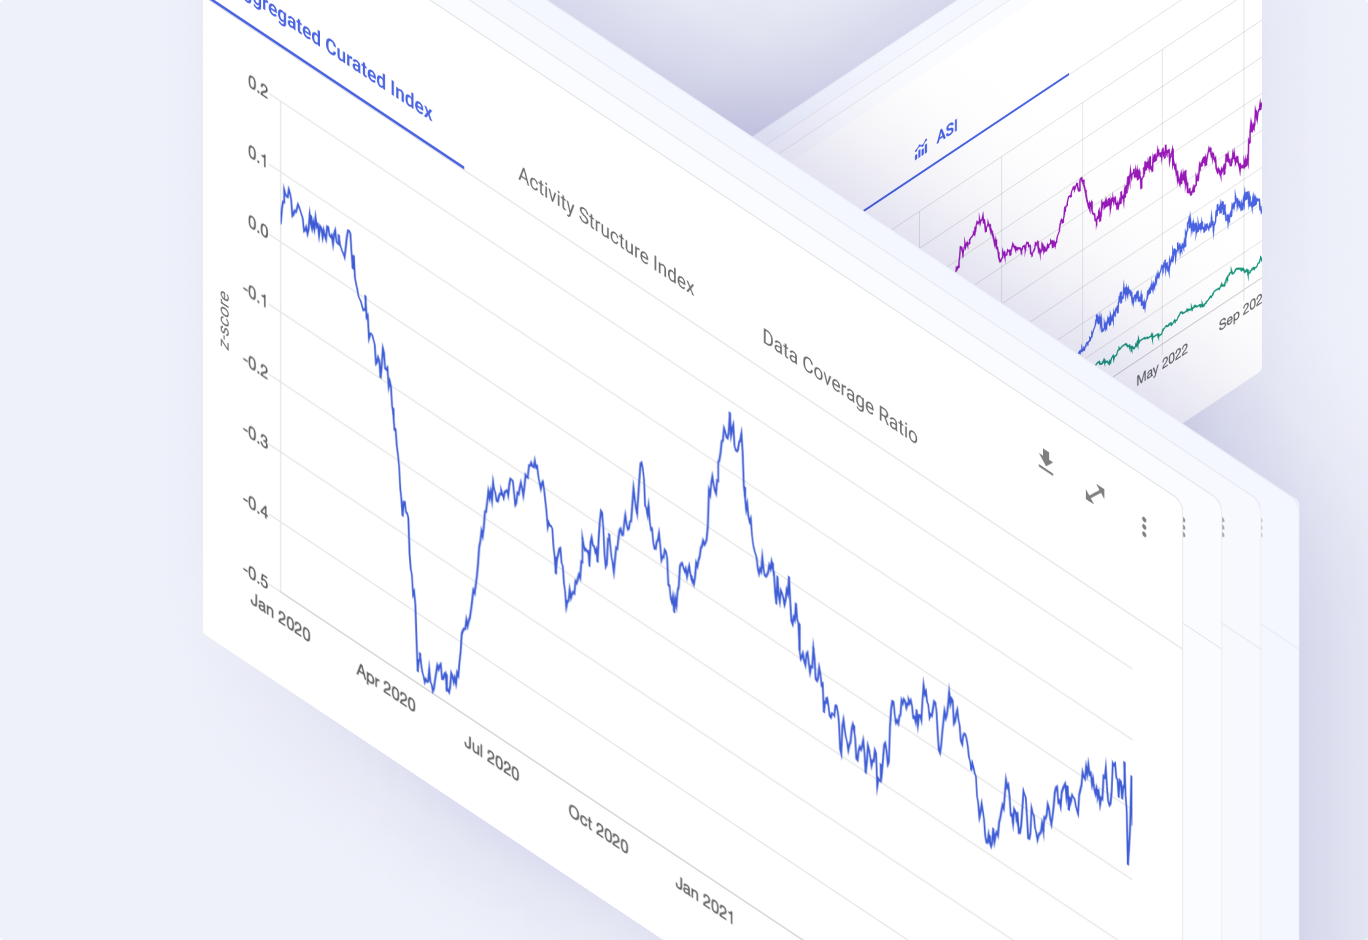
600+ activity indices derived from satellite imagery to leverage proprietary high precision algorithms
Each index provides high frequency near-real-time activity data for specific sectors of interest, this can be related to the country, company, or commodity-related activity.

Know the future before it happens
Identify trends and inflection points before they happen with our SpaceKnow Nowcasting Datasets. Gain insight into what’s on the horizon and be one step ahead of your competition.
Predict tomorrow. Trade today.
With SpaceKnow Nowcasting Datasets you can predict how the economy will change in the future—and trade on those changes to generate financial returns (alpha).
How do we build our datasets?
Research
SpaceKnow’s in-house research team analyses the country, company, or commodity. This sets the foundation to ensure future customers will have relevant activity data and facilitates sufficient coverage of an industry or a country activity.
Locations
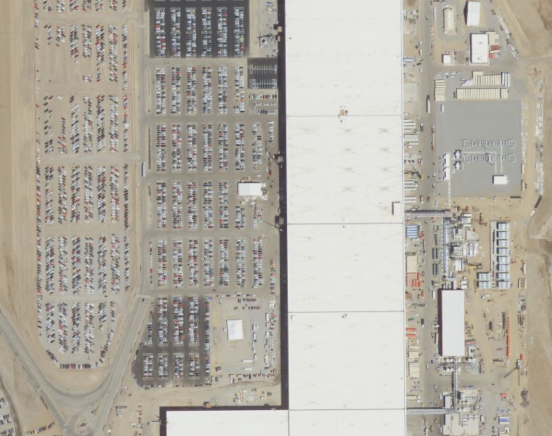
Following the research team’s recommendations, a list of potential high quality locations are collected. These locations could be parking lots, refineries, factories, warehouses, etc. Some indices can cover more than 4000 unique locations.
Annotations
The in-house data annotation team defines and geofences the regions where activity can be measured. Say you’re looking to measure the activity of car distribution centres, the annotation team ensures the adjacent employee parking lot is not part of this signal, to ensure you’re looking at a clean signal.
Imagery
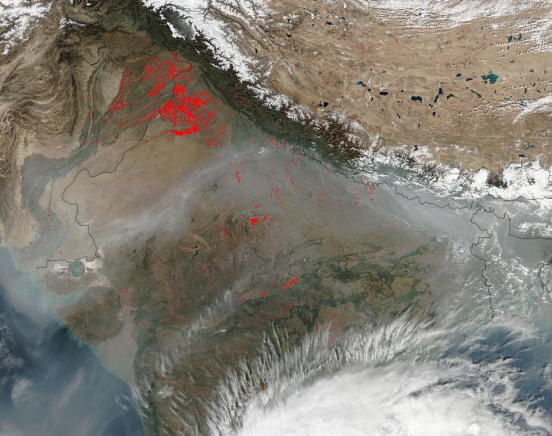
With the locations annotated, the back-end team ‘fills’ these annotations with satellite imagery. For most index datasets, Synthetic Aperature Radar (SAR) imagery is used, primarily because of its consistency and its ability to see through clouds. Learn more about SAR here.
Algorithms
SpaceKnow runs several proprietary algorithms over the filled locations to get raw data. Depending on the industry, different algorithms are deployed to capture relevant activity.
Indices
Following intensive quality control processes that combine manual human-in-the-loop methods with machine learning, satellite activity from the locations are aggregated to create time-series activity datasets. These time-series are then benchmarked by SpaceKnow economists and made available to our clients.
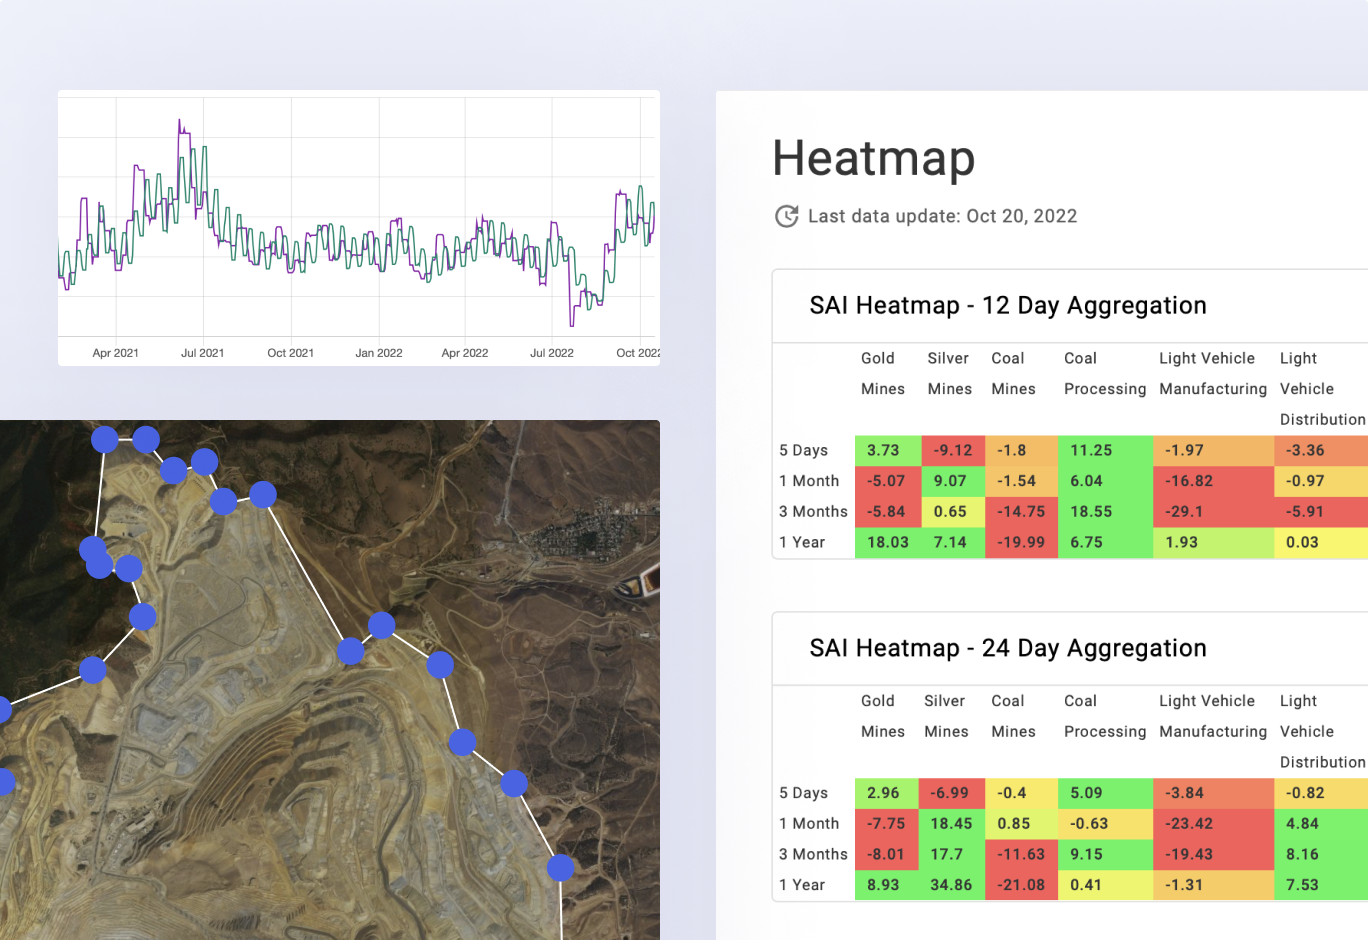
Which datasets are available?
SpaceKnow nowcasting datasets aims to cover all activity across the globe. This includes but is not limited to datasets focused on a country or company’s manufacturing activity, activity measured across mines, logistics centers, smelters, refineries, parking lots, car manufacturing sites, and much more.


Consume SpaceKnow Insights
Access and explore SpaceKnow’s data in several ways: download the raw data, request emailed CSV’s, explore your granted API access, navigate the dashboard, dive into different time-series, and read up on brief and methodology papers. All in one place.
Custom Reports Available
Our internal team of economists regularly analyze our data and create monthly reports for you, which are designed to facilitate better decision making. With research reports in your hands, you can focus on what’s important.