Even if gas prices are currently falling in Europe [1], the natural gas market remains influenced by activity related to Russian Liquefied Natural Gas (LNG). After explosions ruptured NordStream pipelines, gas deliveries were suspended from the two pipes crossing the Baltic Sea. [2] The situation with the Ukrainian pipelines, another critical route of Russian gas to Europe, is fragile, and other direct routes of Russian gas to Europe will find it difficult to compensate for the decrease in gas flows. [3, 4]
The current status quo raises several questions, some of which are:
- What is Russia doing with the natural gas that was supposed to be sent to Europe?
- Is Russia burning gas at its LNG facilities, or even venting it?
- Does Russia plan to produce less, or will the gas be sold proportionally more to other regions?
Data from space can shed light on the questions raised above and help evaluate the environmental, economic and geopolitical consequences of the current situation.
1. Onshore LNG Activity Monitor
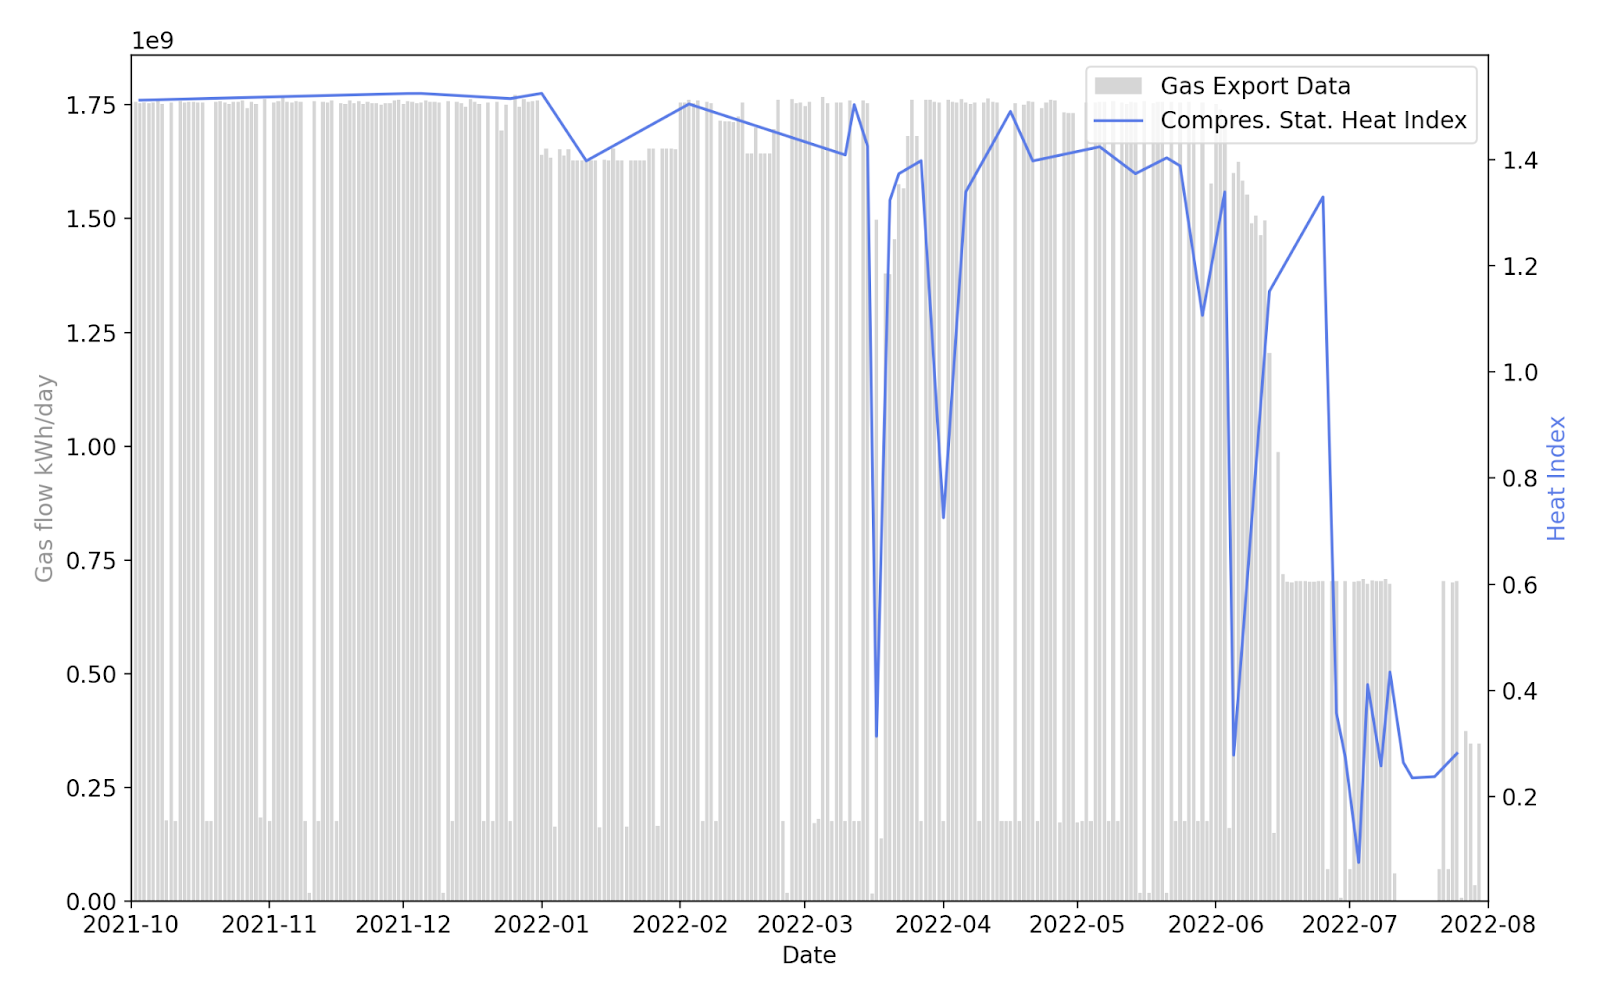
SpaceKnow has deep experience in monitoring industrial facilities. Its most recent tool, the onshore LNG Activity Monitor, is based on precise analysis of heat sources above trains and compressor stations and their changes in time. These signals serve as a proxy of activity in an observed LNG facility.
The LNG Activity Monitor dataset provides near-real-time information about scheduled and unexpected shutdowns, declines in activity levels, or flaring intensity on the level of individual facilities and even trains.
How can SpaceKnow’s Onshore LNG Activity Monitor help answer some uncertainties about Russian gas?
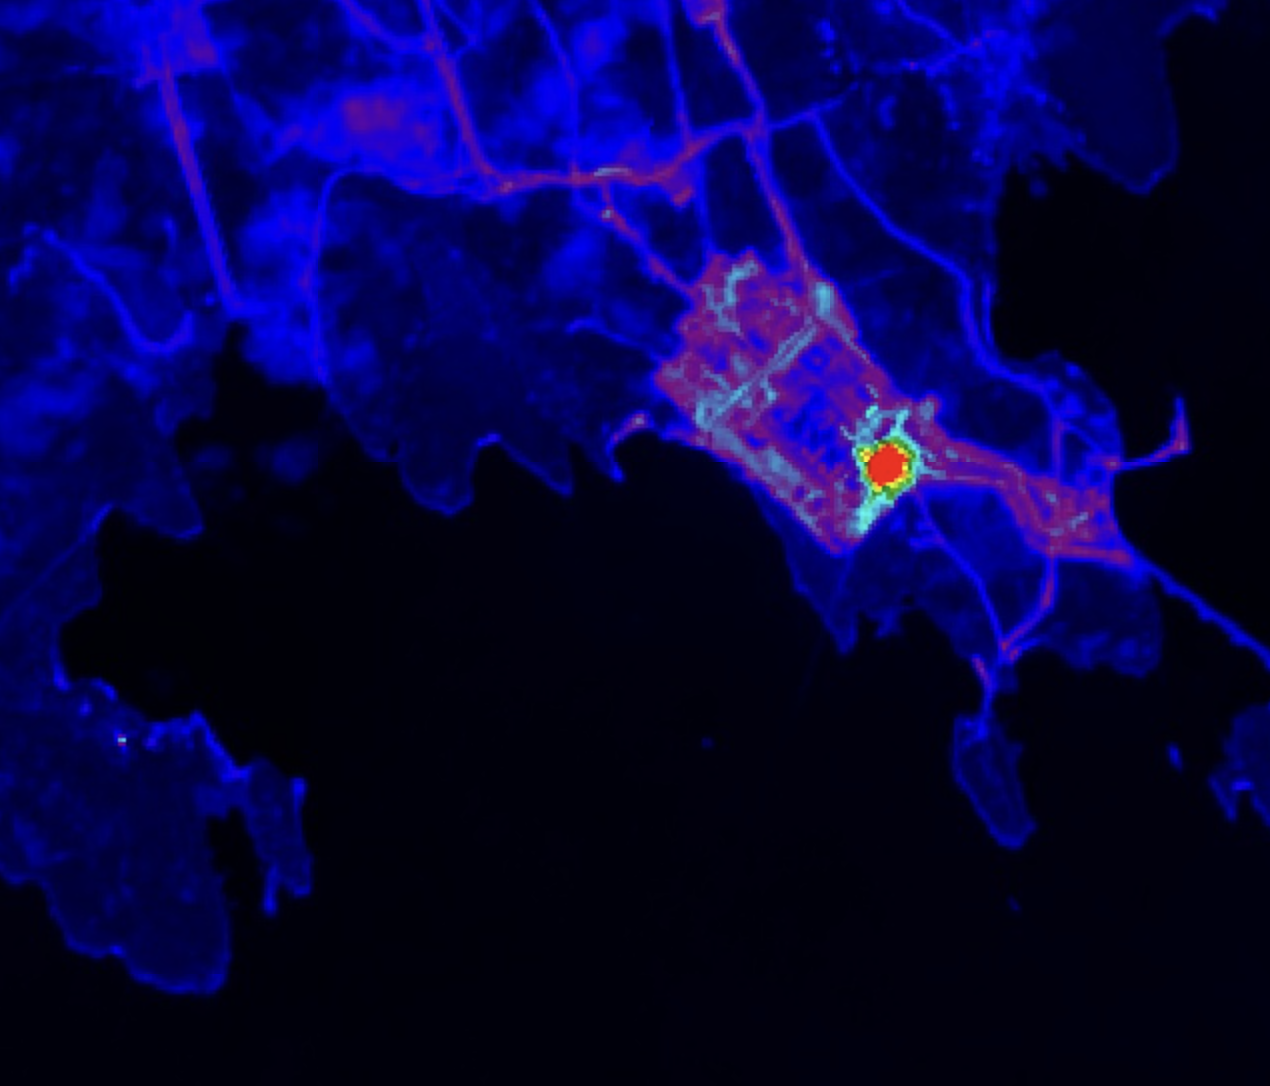
The LNG Activity Monitor helps to observe anomalies in the activity of facilities based on observations from space. For example, SpaceKnow is persistently monitoring the activity of Nord Stream’s Portovaya LNG terminal and detects its outbreaks and declines in production. This proved useful this summer to confirm gas production disturbances at Nord Stream. (Find the summer report on Nord Stream here).
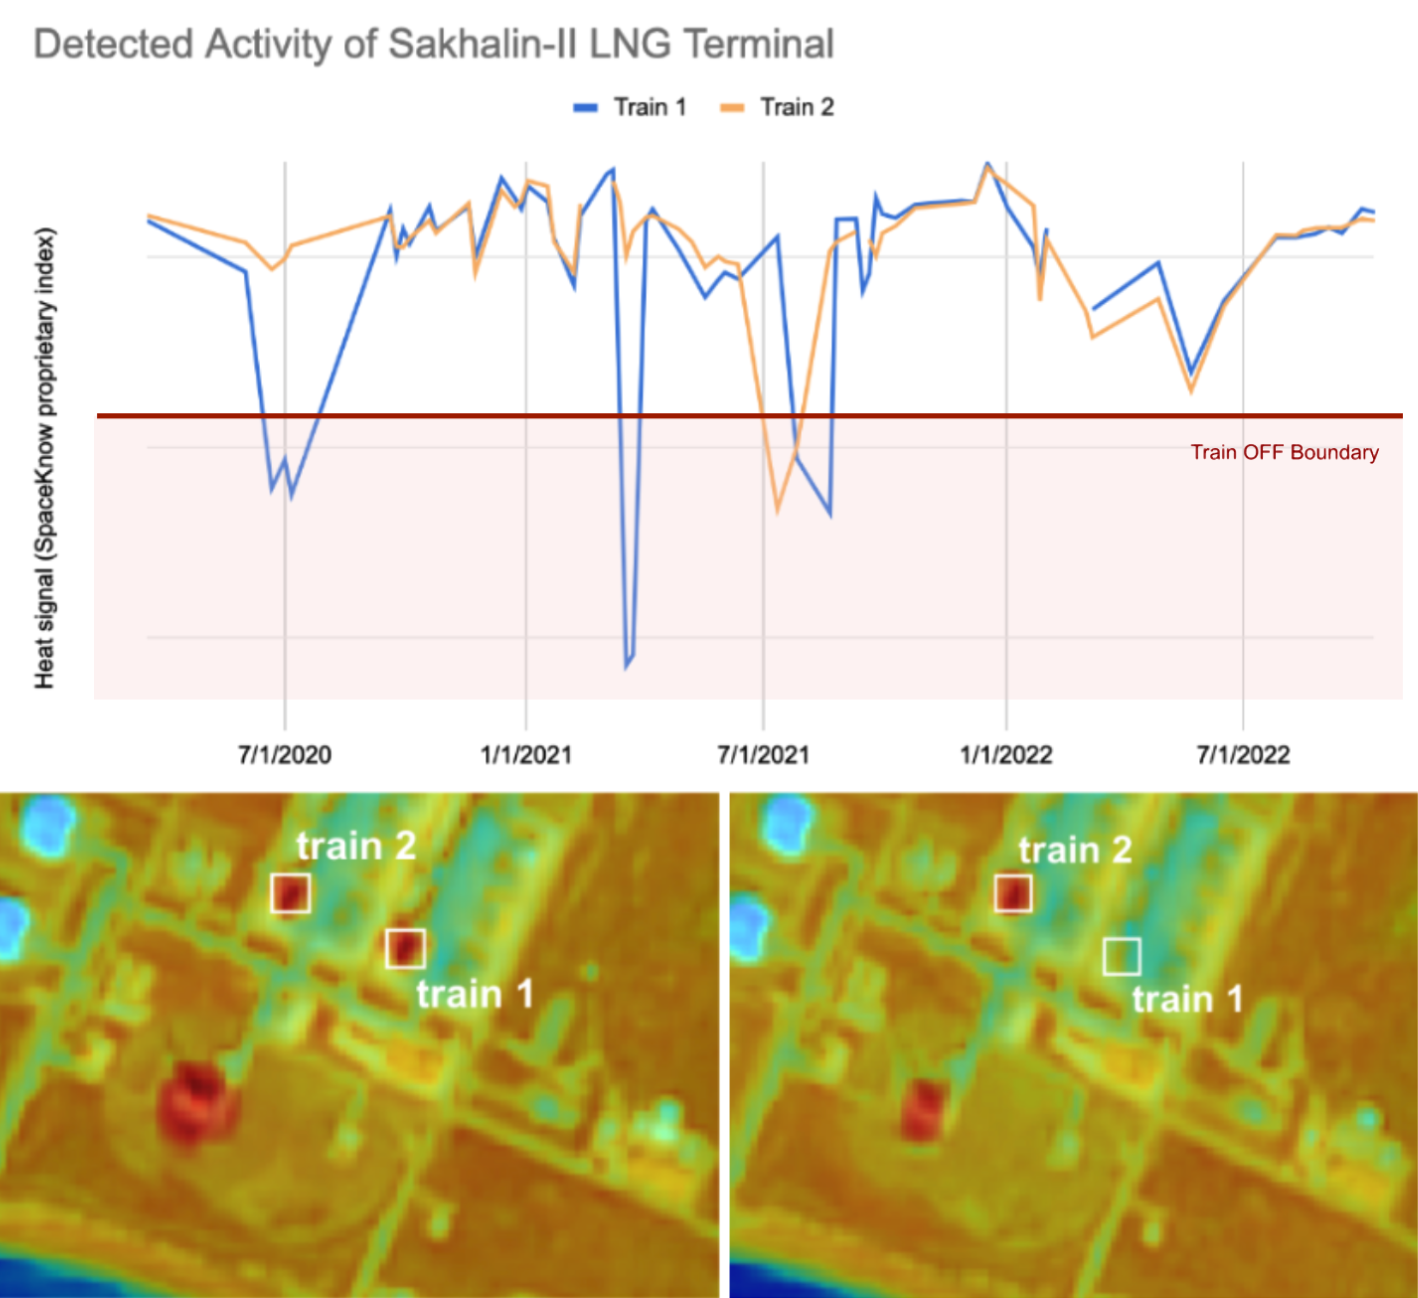
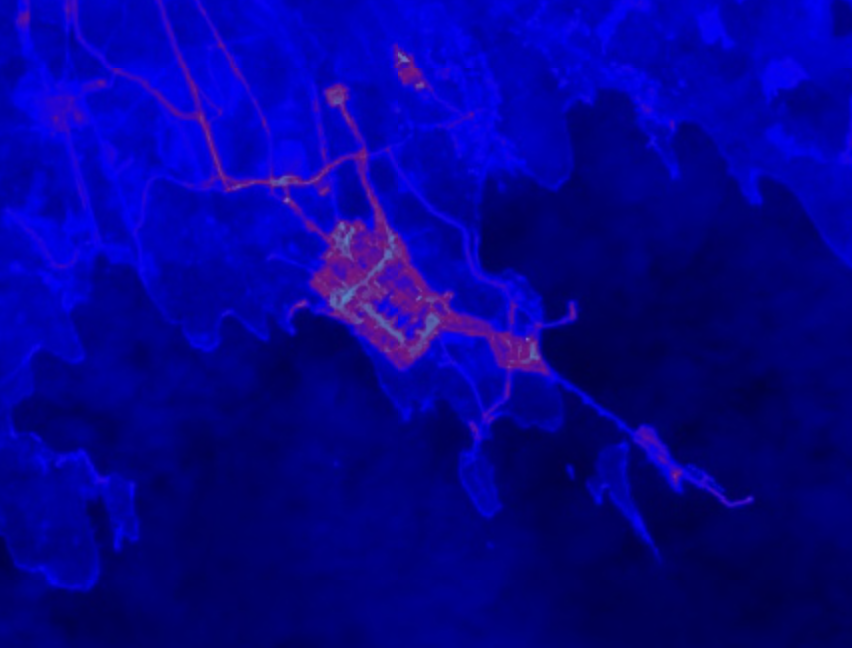
For the Sakhalin-II LNG Terminal (Figure 3), the facility with the second largest capacity in Russia, our observations indicate that the activity at Sakhalin-II LNG Terminal remains uninterrupted. [5]
It is possible to monitor all developments in detail – at Portovaya LNG, Yamal LNG, Sakhalin-II LNG or other global onshore LNG terminals. To further improve the quality of insights, it is recommended to combine these heat signal data with data about flaring.
2. Flaring Detection
Data on flaring from satellite analytics is commonly used to track fires and various events in refineries, oil wells or LNG terminals. Initial detection of flares is usually based on the Visible Infrared Imaging Radiometer Suite (VIIRS) and Moderate Resolution Imaging Spectroradiometer (MODIS) instruments (NASA).
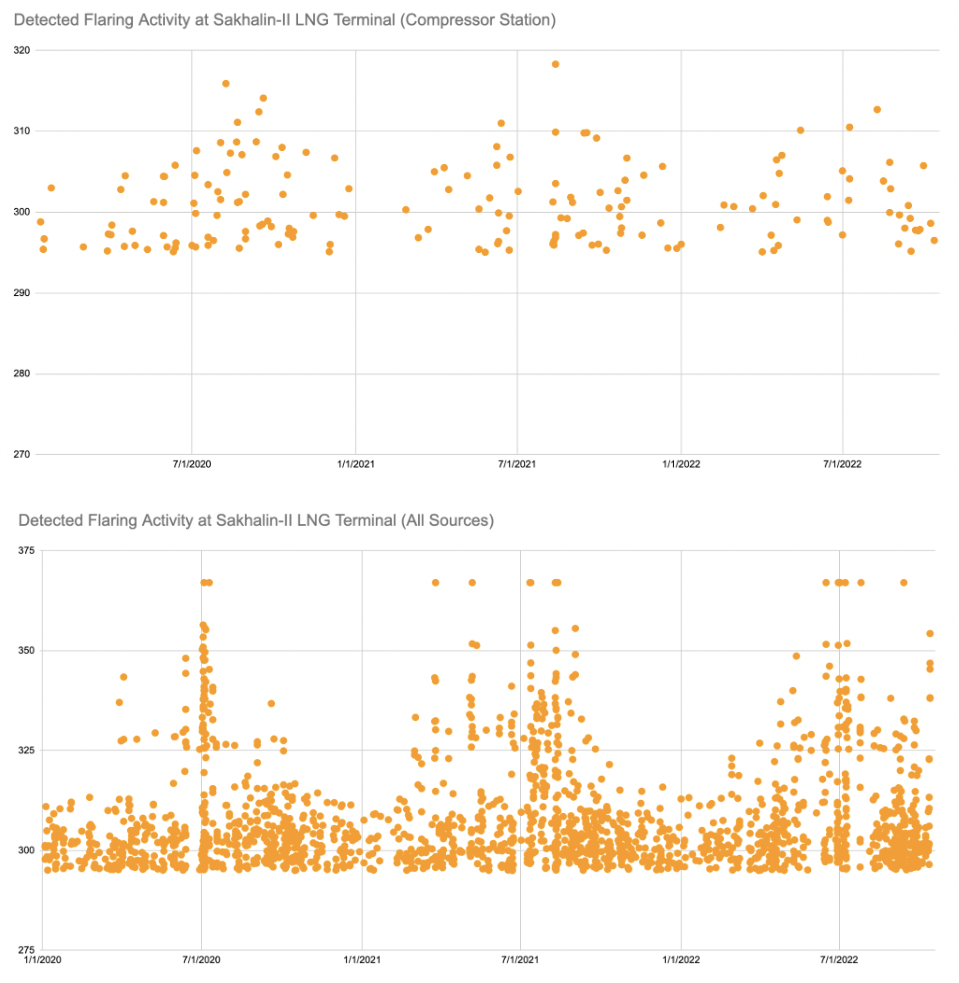
When interpreting flaring data above energy facilities, it is essential to distinguish between multiple sources of flares and heat. The heat signal (as described in the section above) is measured primarily at a compressor station and trains of an LNG terminal. Flaring occurs either at a compressor station as part of maintenance work (on a smaller scale) or at the LNG terminal as part of rather unusual events (on a bigger scale). However, it can differ for different locations due to various technological processes.
For example, unprecedented massive flaring was observed at Nord Stream from mid-June onwards. However, the frequency and intensity of flaring have been declining since September.
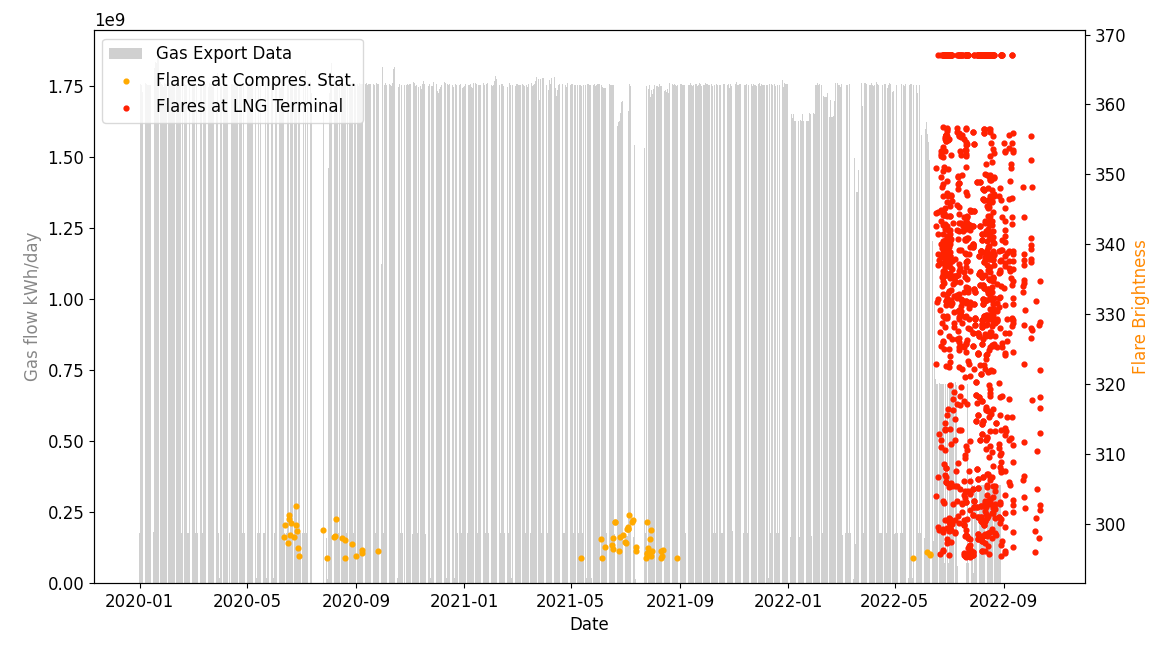
Sakhalin-II LNG Terminal can be another example among Russian facilities to demonstrate the flaring data (Figure 5). Analyzing available flaring data from the past three years suggests that there has been no unusual activity at Sakhalin-II LNG Terminal in recent months.
Insights on flaring intensity can serve together with heat-based activity monitoring as a useful tool for understanding the Russian LNG market. Additionally, massive flaring has serious environmental consequences which can be evaluated by satellite data.
3. Emissions Monitoring
Small amounts of flaring are inherently connected to the operations of LNG terminals as part of safety maintenance. Sometimes, gas is also flared due to the need to get rid of excessive gas, so-called “boil-off gas”, that arises from inefficiencies in the processes (in technologically advanced and environmentally cautious facilities, this happens less). [6, 7] Besides these, flaring at LNG terminals can occur due to other politics-related or tech-related events.
When gas is flared, i.e. burnt, it mainly produces carbon dioxide. When the gas is not flared but vented, it directly goes into the atmosphere without burning. This is worse environmentally because pure methane is estimated to be 80-times more harmful to the environment than carbon dioxide. [6, 8]
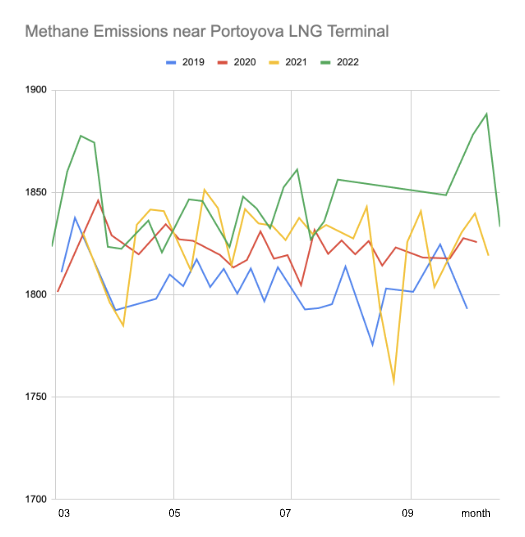
For that reason, SpaceKnow is monitoring the level of methane emissions in areas surrounding the LNG terminals. For example in the case of Portovaya LNG terminal (Figure 7), we can see that the overall trend of methane emissions is increasing over time which corresponds with a global trend of methane emission.
Between April 25 and October 10 of this year, we can observe an increase, with the biggest jump observed in mid-September, right when we observe gaps in flaring. This may indicate that some methane might have been vented directly instead of being flared. However, more information would be needed to confirm this. In October we see a decline which can be partly attributed to seasonal effects since heavy clouds during cold seasons hinder the measurement’s precision.
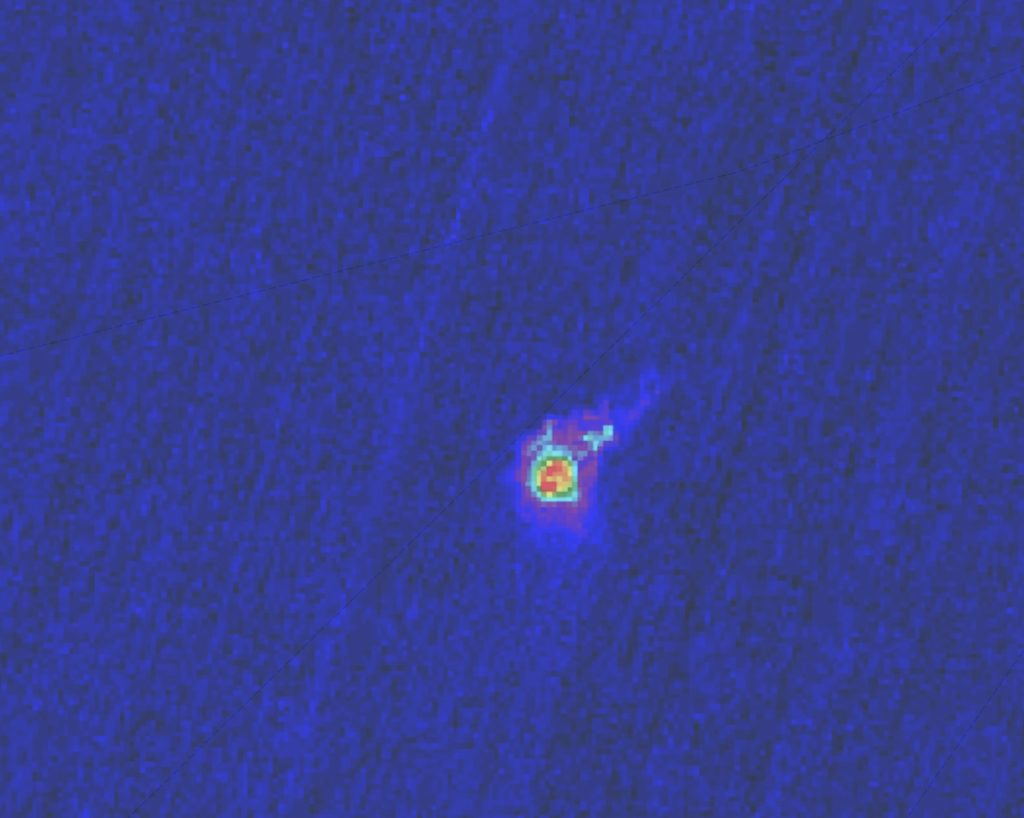
Satellite analytics can detect major methane leaks and help to evaluate their extent and exact location. The task is not trivial as the measurements tend to be strongly affected by atmospheric conditions (as shown in the example above). Additionally, some important instruments have limited functionality above open water. However, there are often ways to gain desired insights, for example with the detection of the methane leak above the damaged spots at the Nord Stream pipelines (Figure 8).

Here to help
In this post, we walked you through SpaceKnow’s approach and provided examples of satellite insights about the currently tense gas market. Whether your organization is interested in looking into economic, geopolitical, or environmental aspects of the events happening in the gas market, SpaceKnow can help to answer the many unknowns.
Interested in learning more about SpaceKnow’s commercial products? Reach out to info@spaceknow.com