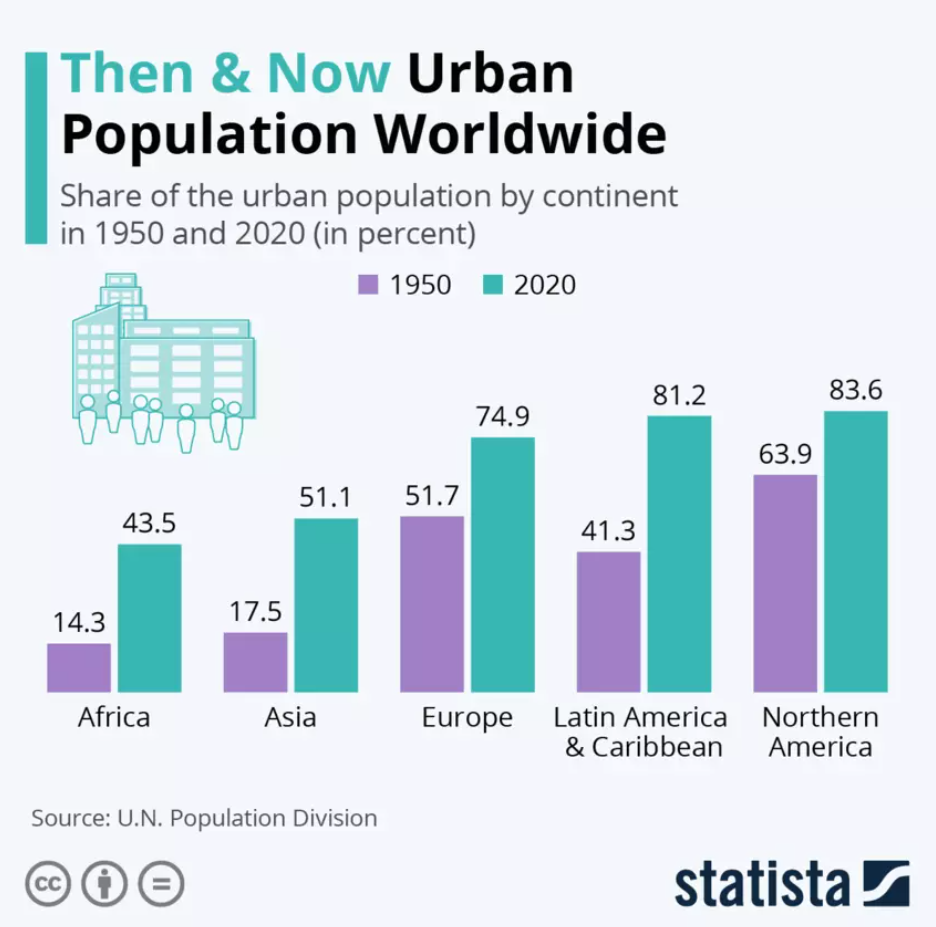
Urbanization is on the rise. More than 4 billion people, over half the world’s population, now live in urban areas. It is estimated that by 2050, 7 billion people, or what will by then be about two-thirds of the global population, will live in cities. A great example of this trend is India, which has almost doubled it’s urbanization percentage in the last 50 years. According to a study conducted by Oxford Economics, the world’s top 10 cities with the fastest-growing economies will be in India over the next 25 years. They also project 17 of the top 20 to be in India.
Urban growth – the growth and decline of urban areas – is inextricably linked to urbanization. This has a number of implications for the economics of the city as well as the country. Among these implications are efficiency of production and distribution, the labor market, and overall growth.
There is no standard way to measure urban growth – it varies from country to country and even from jurisdiction to jurisdiction. Economic variables commonly used to measure urban growth include population, area, employment, density, and usually some combination of them at once. Census data usually provides the foundation to calculate urban growth, and as we all know, these surveys are conducted once every 10 years. The next census in India will be conducted in 2021.
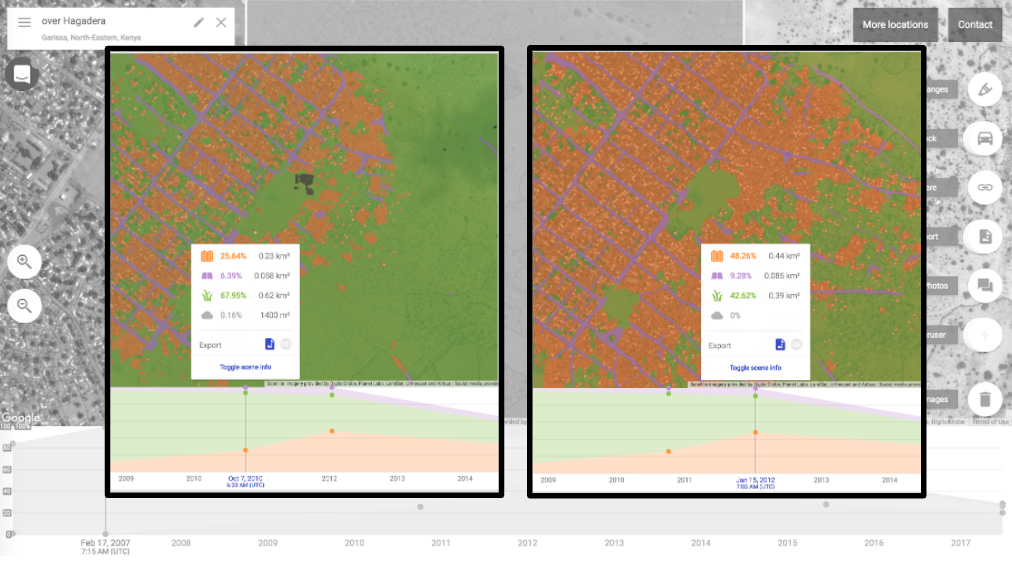
At SpaceKnow, we use satellite data to quantify urban growth. We use our proprietary algorithm, referred to as WRUNC, that segments both optical and SAR satellite imagery into Water, Roads, Urban, Non-Urban, and Clouds. This segmentation, when analyzed over time, tells us how the land-use is changing. Because this algorithm works on low-resolution imagery, we are able to quantify urban growth occurring over vast swaths of land, such as a city. Here is an example of our WRUNC algorithm applied to high-resolution imagery of a fast-growing refugee camp in Kenya.
Our approach gives us a unique perspective on this topic. First, our machine learning algorithm is unbiased – the data produced is based on what the AI actually “sees” on the ground. Second, we are able to measure urban growth as often as we receive a cloudless picture from our satellite constellation, which is obviously much more frequent than the census. In this article, we analyze India’s fastest growing city using our WRUNC algorithm.
Surat, India
This port city has grown in population by an average of 4.81% since 2017. A major hub for diamond processing, textiles, and IT, the previously mentioned study by Oxford Economics claims that Surat will be the fastest growing city in the world (in terms of GDP) over the next 25 years. The study projects Surat to grow 9.17% YoY, from 28.5 billion to 126.8 billion.
We used our WRUNC algorithm on satellite imagery of Surat over the past 4 years, to see if our data supports this narrative of explosive growth. We filtered out all imagery with cloud cover, and produced the following chart showing the change in urban + road area over time.
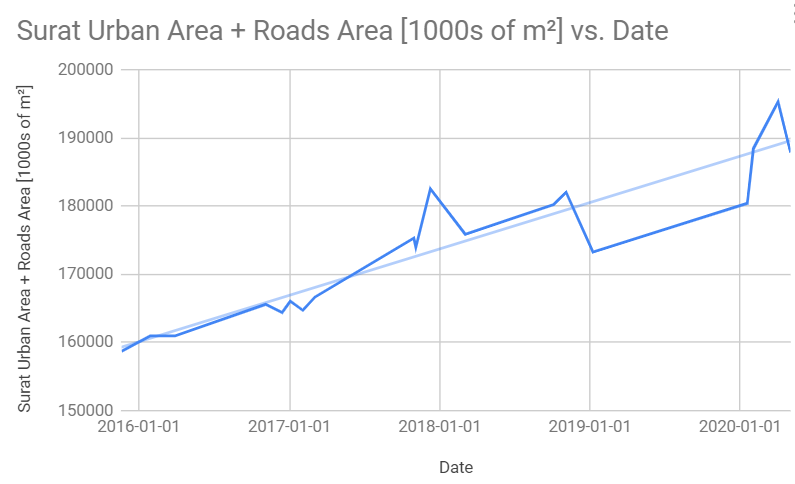
As you can see, the first data point is at the end of 2015. This is because the satellite imagery we used for this analysis was collected by the ESA’s Sentinel 2, which launched in 2015. You may also notice that every year, there are long stretches in the summer without new data points. This region has its monsoon season in the summer, so finding imagery without cloud cover during those months is difficult – a classic example of where SAR data becomes useful, as SAR is able to penetrate through clouds and fog.
Perhaps the biggest elephant in the room is the volatility – aren’t urban areas supposed to grow steadily? What’s up with that peak in December 2017? For this analysis, we applied our out-of-the-box WRUNC algorithm to low-res imagery over AOI’s (areas of interest) not seen before. For more precise land classification, high-resolution imagery would be needed, as well as some additional training for the algorithm to “get a feel” for what urban areas look like in this part of the world. However, our purpose in this analysis is to get a general idea of urban growth, so the precision of high-res imagery is not needed. Furthermore, when comparing the growth of urban areas we’ve detected (4.6%) against the population growth estimate (4.81%), you can see that even with low-resolution imagery, our algorithm is not far off.
With India surging forward as a global economic powerhouse, and with the shortage of timely data available in this region, we at SpaceKnow have devoted our attention to using satellite imagery to understand India’s economy beyond the growth of its cities. In October, we released a new dataset covering production activity across a wide variety of industries in the country. This dataset applies our proprietary algorithms to SAR imagery of key industrial locations, to index the daily activity levels occurring within these industries.
Our India dataset includes aggregate indices that benchmark Manufacturing PMI, construction output, and other major indicators. We also have time-series that track specific manufacturing, transportation, construction, mining sub-industries, as well as pollutant gas data by region.
Our indices can easily be used in quantitative models to create more precise forecasts of activity across a variety of industries. Behavior changes can be tracked in near real-time, allowing institutions to be more comfortable with the direction of expected economic change and focus on building precision around magnitudes in their forecasts.
Interested in learning more? Contact us at info@spaceknow.com or visit www.spaceknow.com.