The outbreak of COVID-19 has sent shockwaves throughout the global economy creating an immense amount of uncertainty in its wake. This uncertainty was characterized by questions like: how deep was the economic impact? Will the recovery be V-shaped or U-shaped? Is there a second wave on the horizon? At SpaceKnow, we monitor economic activity at thousands of locations across the globe using the constellation of SAR satellites to offer some clarity in these uncertain times.
SAR stands for Synthetic Aperture Radar. While the sensors on optical satellites capture reflected sunlight, SAR satellites emit radar waves, which are then reflected by objects on Earth’s surface and are received back by the satellite. SAR penetrates through clouds and provides regular data on the surface of the earth, regardless of weather conditions.
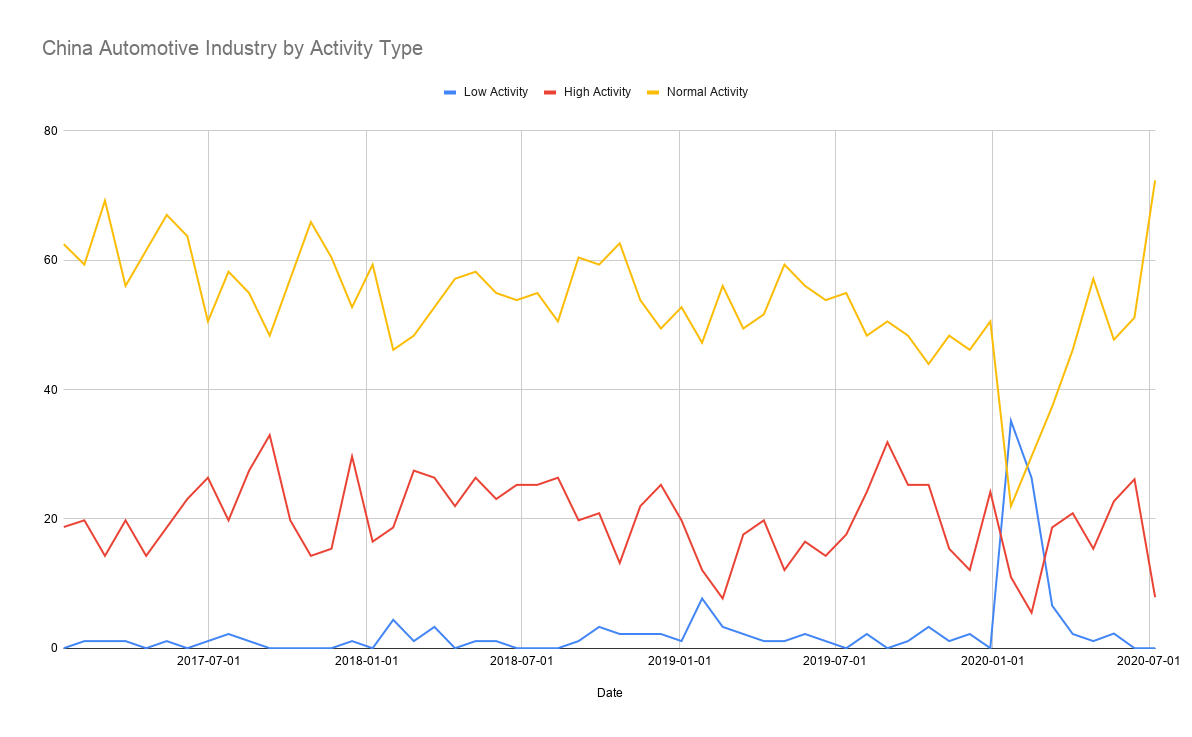
We use a variety of algorithms to process massive amounts of SAR data and create indices of economic activity. One example is the SpaceKnow Activity Structure Index, where we divide up our locations into three groups:
- High Activity – Percentage of industrial sites that exhibit unusually high levels of activity
- Low Activity – Percentage of industrial sites that exhibit unusually low levels of activity
- Normal Activity – Percentage of industrial sites that exhibit usual activity
Here’s what our Activity Structure Index for China’s automotive industry looked like from early 2017 to July 1st of this year:
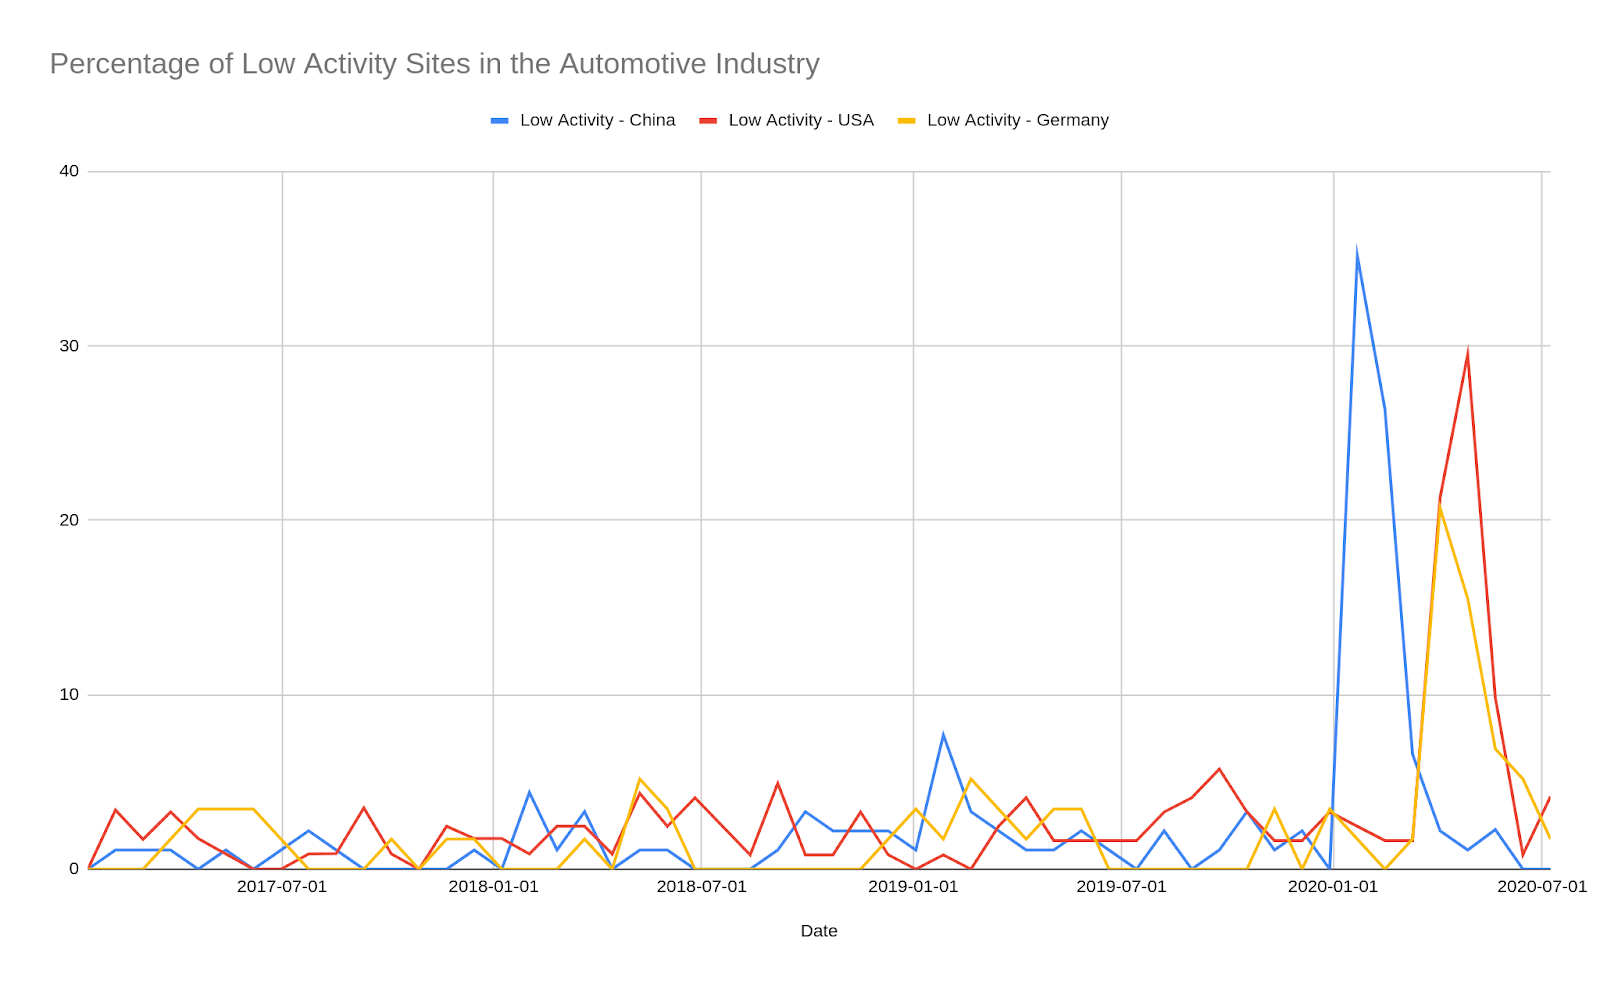
When we compare low activity country-to-country, the results are interesting. Below we see major anomalous events during the main lockdown period in different countries at different times. In China we see a major shock in the data in February, in Germany the event occurs in March, and in the US we see the shock in April.
Originally, the Activity Structure Index was created as a qualitative tool to understand the underlying tendencies in our data, but it has a broader purpose. It can serve as a warning signal for economic inflection points. There are also some interesting quantitative use cases for this index, such as modelling forecast errors or measuring the overall dispersion of activity in a single sector.
For more information, get in touch here or reach out to info@spaceknow.com