Europe is currently experiencing a fresh rise in COVID-19 cases and governments have been issuing new restrictions every week. Should we expect economic activity to respond in a manner similar to the spring lockdown? In order to answer that, we looked at Satellite Activity Indices (SAI) in the UK and Germany, from our new SK Industry Radar product suite.
The Satellite Activity Indices (SAI) are a family of unique, daily, unbiased near-real time indicators of economic and production activity in a variety of sectors and countries. The SAI analyze and measure changes visible from space at locations carefully drawn and annotated by our experienced data team. With this high-frequency data, forecasters can observe trends or changes in economic behavior as they unfold.
One noteworthy feature is our usage of Synthetic Aperture Radar (SAR) data for these indices. While most images from space are passive optical images (similar to a photograph), SAR is a type of active data collection where a sensor produces its own energy and then records the amount of energy reflected back after interacting with the Earth. SAR data is responsive to surface characteristics like structure and moisture and has the ability to see through clouds and in darkness.
We broke our analysis into three parts: How does the impact of the recent measures compare to the lockdown earlier in the year? How have different industries within a country been affected by the latest measures? How have various industries across countries been affected by different containment policies?
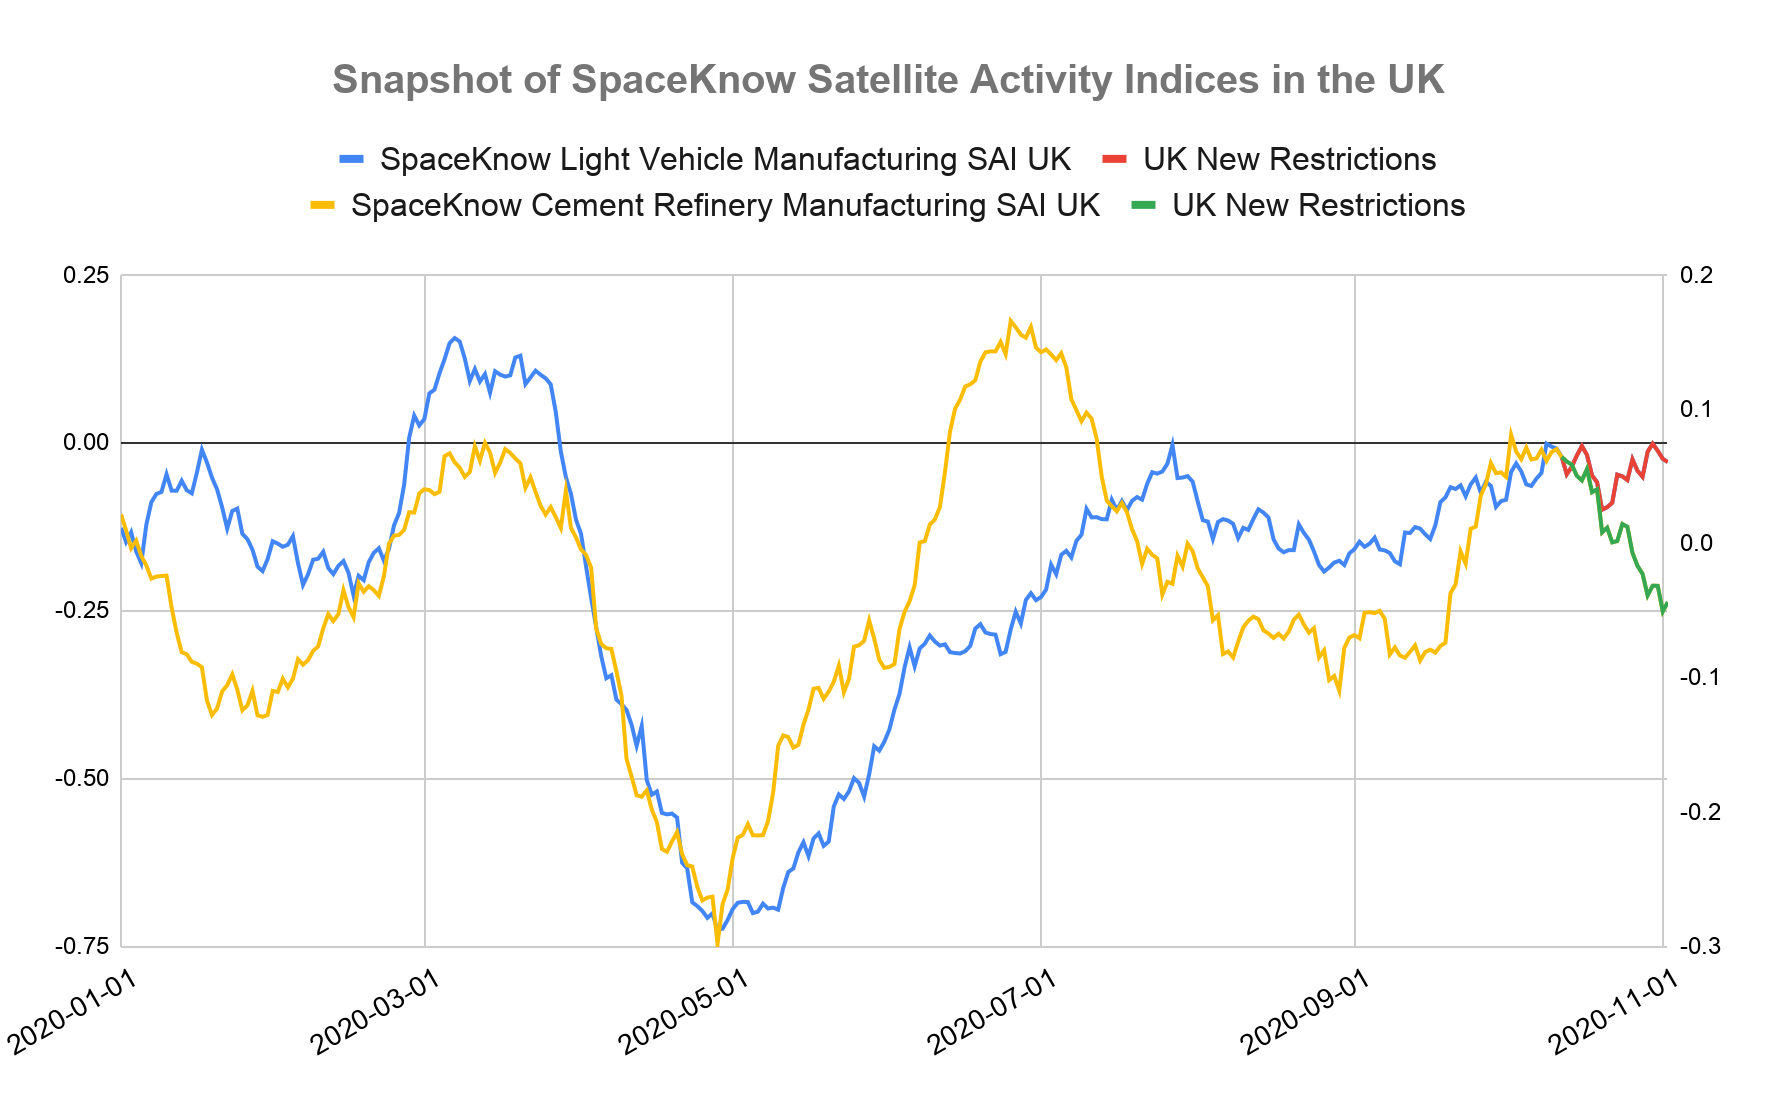
First, we chart two different sectors from the UK: light vehicle manufacturing (a large component of industrial production) and cement (which leads construction activity). Currently, the automotive industry appears resilient while the cement industry has experienced a moderate decline since the new restrictions were announced on October 12th. In the spring, both sectors experienced a much larger slowdown in activity. Most of our industrial sector indicators show a similar pattern to the automotive sector in October, suggesting perhaps that factories had prepared for a second lockdown and were able to continue production with changed policies. Construction seems to be more severely impacted and we will continue to monitor activity closely there.
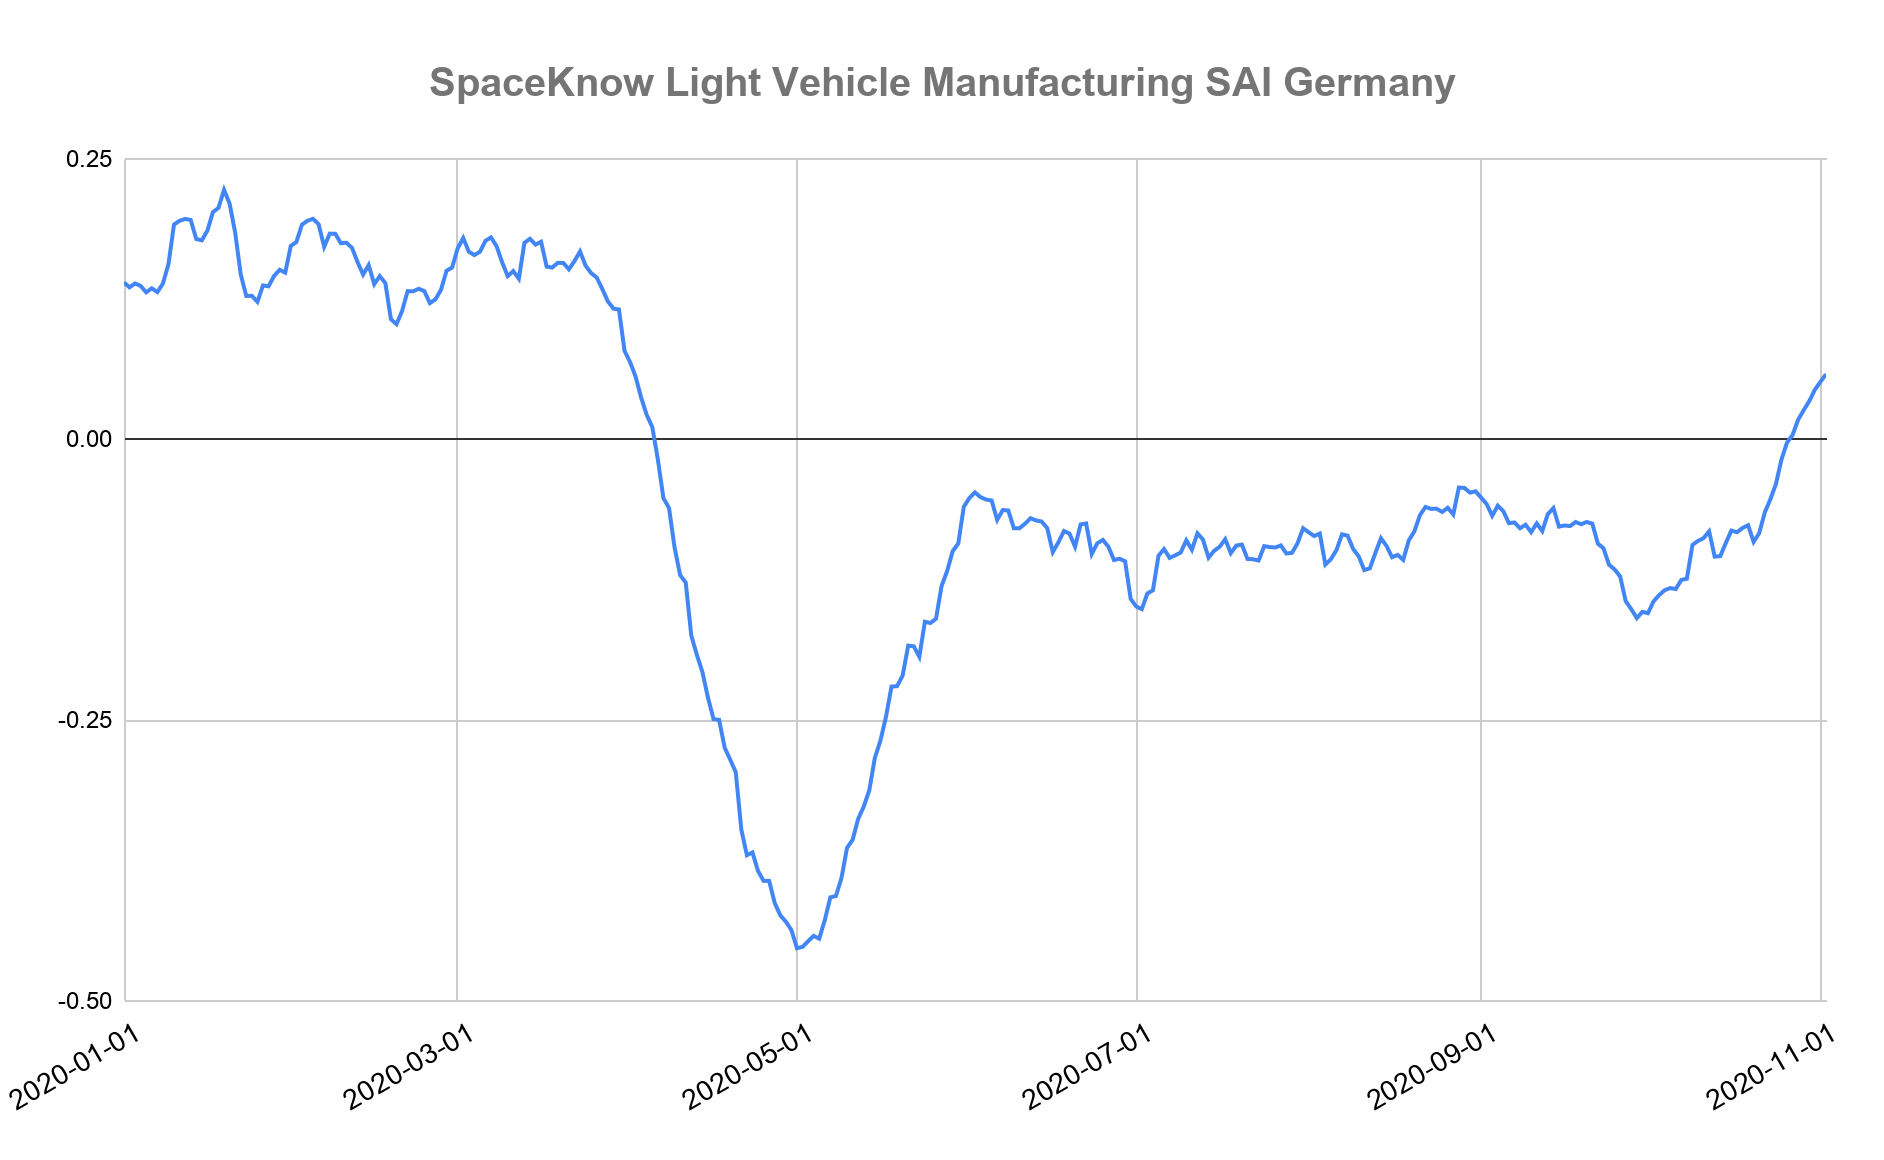
In Germany, our Light Vehicle Manufacturing index actually rose going into the latest containment measures. Again, given industrial facilities had 6 months to prepare for a second lockdown, it suggests that impact on manufacturing will be moderate unless demand for products starts to slow.
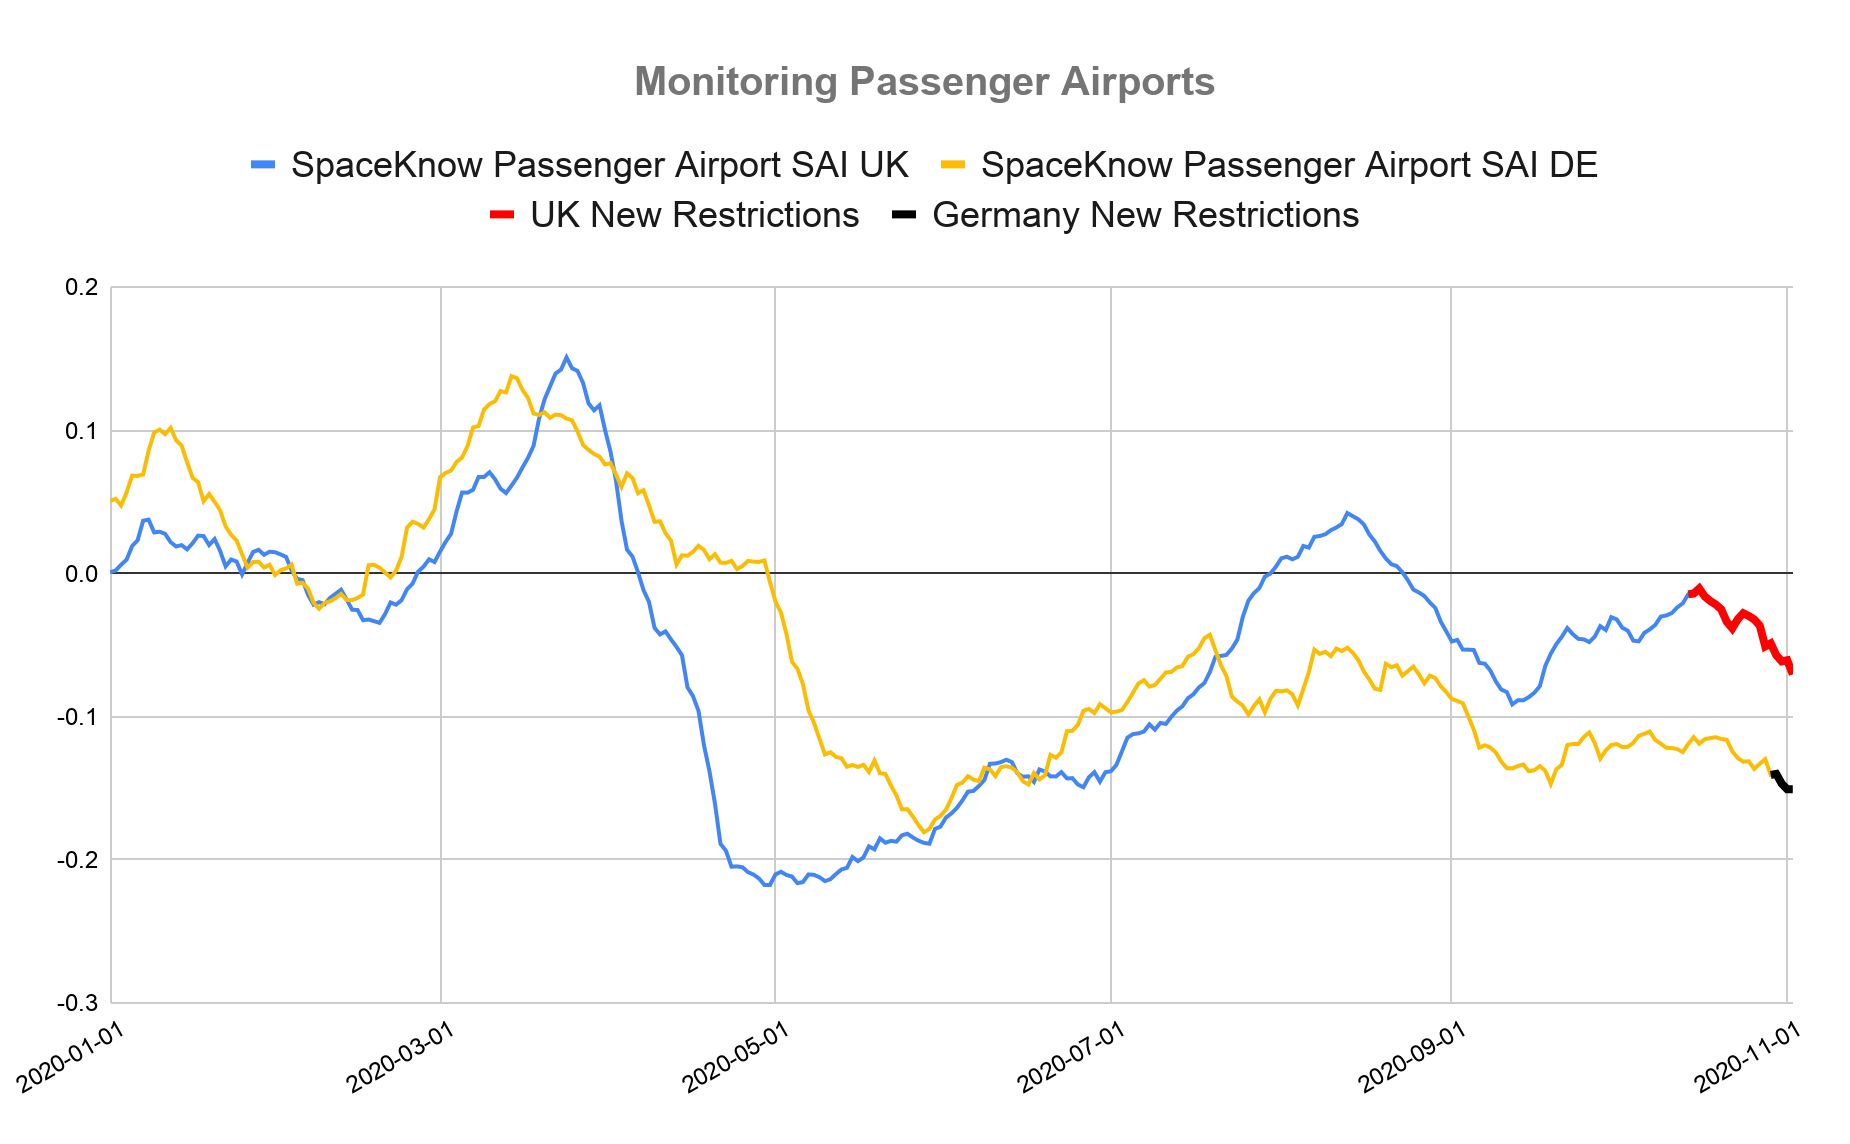
We also looked at transportation sectors such as air travel. We compare our Passenger Airports SAI for Germany and the UK in the chart below. These SAIs capture overall aircraft activity at all major airports in each of these countries on a daily basis. Here the impact of the lockdown can be seen clearly.
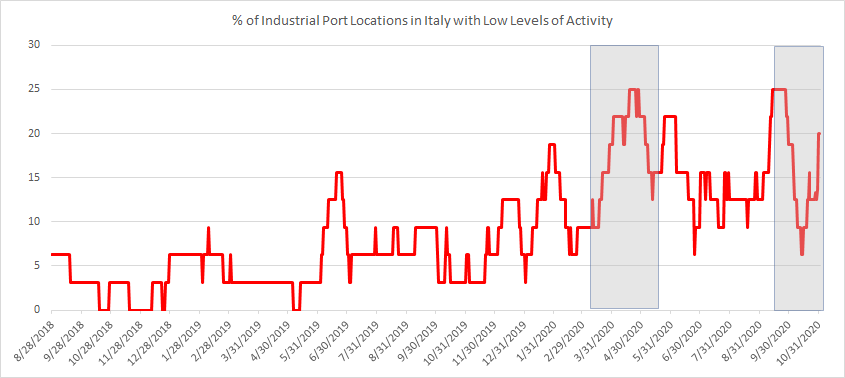
In Italy, shipping companies complained in the spring that ships docked at Italian ports were unable to travel to other areas due to fears of COVID contagion. Our graph below shows an interesting development. Well before the second lockdown was implemented, and as COVID cases started to rise again in Europe, port activity in Italy had already slowed down. Given shipping restrictions due to COVID, it would be rational to reduce ship traffic to Italian ports as soon as cases began to rise in the country.
Our conclusion is that in general, this lockdown seems to have a more moderate and narrow impact than the first one, especially in manufacturing. Service-sector industries, reliant on mobility and traffic, have been affected immediately, while manufacturing has shown more resilience across the UK and Germany.
Our SAI’s can easily be used in quantitative models to create more precise forecasts of activity across a variety of industries. A deeper and more quantitative analysis using our indices from all the lockdown countries would allow a forecaster to, at the very least, create bands of certainty around their projections. Behavior changes could be tracked in near real-time, allowing institutions to be more comfortable with the direction of expected economic change and focus on building precision around magnitudes in their forecasts.
Interested in learning more? Contact us at info@spaceknow.com or visit spaceknow.com.