The festive season is right around the corner, but despite the bright Christmas lights, a dark blanket of doubt rolls over America’s supply chain, bringing with it fears of empty shelves and unhappy customers.
SpaceKnow is bringing its customers a front-row seat to the supply chain action with its latest dataset focused on the US Supply Chain. The dataset includes a collection of indices that act as proxies for activity. With more than 4 000 locations monitored from space across the USA, including every major US port container area, truck stop and logistics center big enough to be considered relevant. Users will have near-real time insights on the supply chain situation. The SpaceKnow team is confident that these indices can provide useful information for multiple opportunities.
Below we have selected 3 use-cases:
- Warehouse utilization for major logistics companies
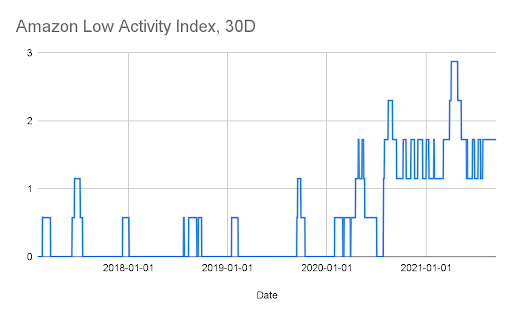
Here is a graph (Jan 2017 – Sept 1, 2021) of percent of Amazon warehouses with low (almost no) activity. As we know, Amazon warned that supply chain issues would impact Q4 earnings. Our data on Amazon logistics centers gives you a near-real time read on their performance. We provide similar data for Walmart and Fedex.
- Inflation indicator
We can help you determine whether the recent rise in Consumer Price Index (CPI) is permanent or transitory. Here is our port container index mapped against inflation. In a recent hackathon contest at Eagle Alpha, Ottoquant used our data (along with information from a few other providers) to predict monthly inflation numbers. Ottoquant’s model won the contest.

- Supply Chain chokepoints
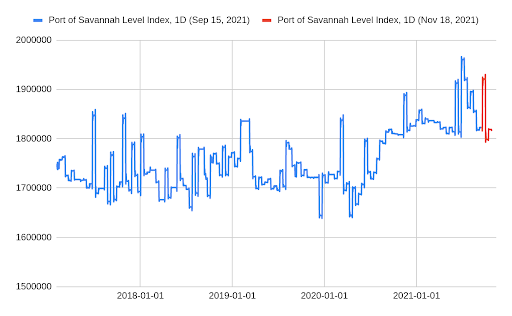
Here is a graph of container congestion at the Port of Savannah. As containers pile up at other ports, Savannah is picking up the marginal traffic. Watching the changes here could give us a near-real time read on bottlenecks.
Warehouse utilization, inflation indicators and the identification of supply chain choke points are just a few of the possible use-cases of our US Supply Chain Dataset. The dataset is currently available to SpaceKnow customers in raw data form, but also in the form of curated research reports. Not everyone interprets data in-house, for those who don’t, we offer research reports where our experts provide a blow-by-blow account of how year-end supply chain blockages are affecting spending and inflation.
For further details and information about our NowCasting solutions do not hesitate to reach out and contact us directly at insights@spaceknow.com.