Through a few years of precise development, lessons learned, and some savvy hiring, SpaceKnow has acquired the ability to measure the industrial activity of any country using satellite imagery. However, getting to this point has been anything but simple. Quantifying industry activity using images of the earth requires an immense database of locations. Quantity is one thing, but the quality is another, and is perhaps of even more importance.
Quality Locations Make for Quality Data
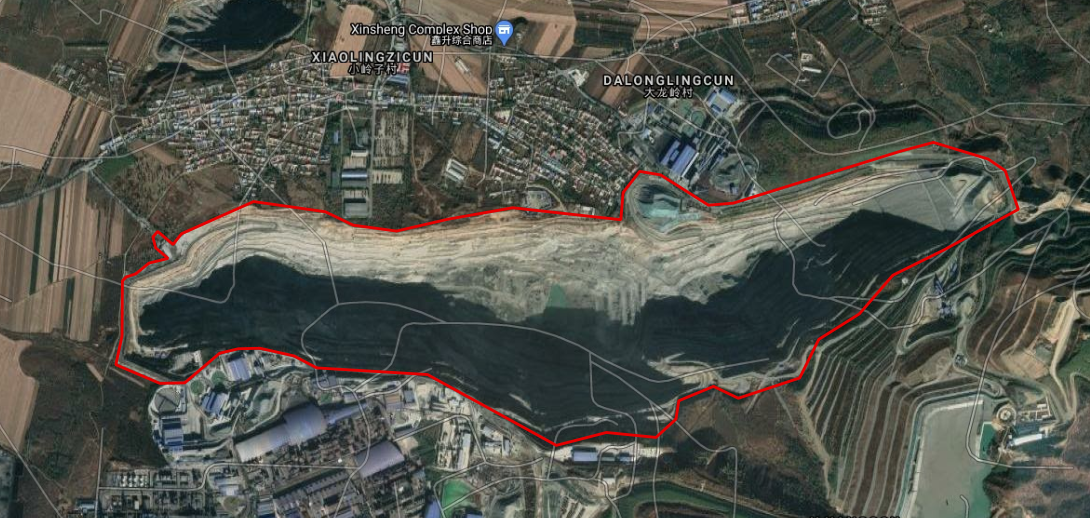
For example, in order to monitor Chinese limestone mining with satellite data, you must first build a database of locations. Our data team is responsible for this task. Their job, in the example of Chinese limestone mines, is to find, create (drawing a precise polygon around the facility), and label a sufficient representative sample of limestone mines in China. We generally aim to capture 80% of relevant locations within a country. In China, we have a database of almost 400 limestone mines.
While our in-house data annotations team is top-class, we have in place a series of controls to ensure the quality of our locations and therefore of our final product.
This process, for now, is “insured” by the fact that each step is the responsibility of a different team, which helps eliminate the possibility of issues due to human error. Our process is partly manual and partly automated. We have built several high-quality tools in-house for our data team. Thanks to our extensive database of precisely drawn locations and of ground-truth, we are able to train neural networks for future automatic control.
One of the main priorities of our company is to maintain and extend this massive database of locations from around the world, including structured metadata. The contents of this database are created based on strict guidelines we provide our data team for each new project. This is to keep the data within our database consistent.
Before we release a new SpaceKnow Nowcasting dataset (built by executing computer vision algorithms over these locations and aggregating the results), a detailed check is performed at the level of the individual polygons. So, if we have a dataset with more than 80,000 locations included in the calculation of the index, we go through each of them to make sure they are up to our standards. If not, we iteratively improve the quality.
Quality Assurance and Control
To start, we look for locations that provide strong and well observable signals. These are mainly locations whose production-related processes take place in the open air. During the secondary control, we search for locations that have been poorly annotated. A good example is the building supplies producer shown below.
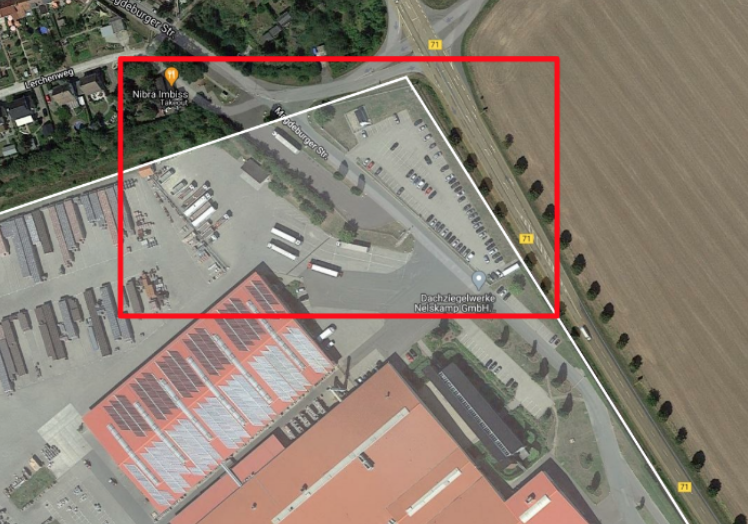
This polygon should not include the external road and parking lot. In such cases, our algorithm would capture activity occurring outside of the site, which is not related to the industrial activity. This could impair the quality of the signal and therefore of the final product. The example shown above is fairly simple; most issues faced by our data team in reality are more complex. These secondary controls place high demands on the precision of the location’s creation.
The research team, who is responsible for algorithm and index development, discovers the internal structure of the polygons at the signal level. We monitor for algorithm failure. We could, when reviewing an airport location, for example, see that the algorithm detected change, however, this change is not connected to airport traffic.
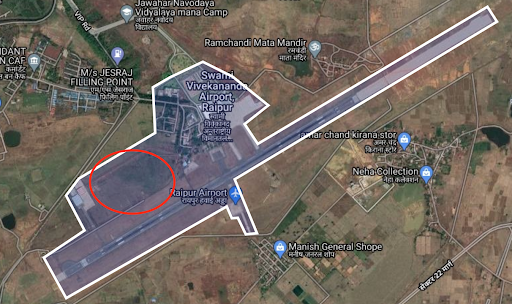
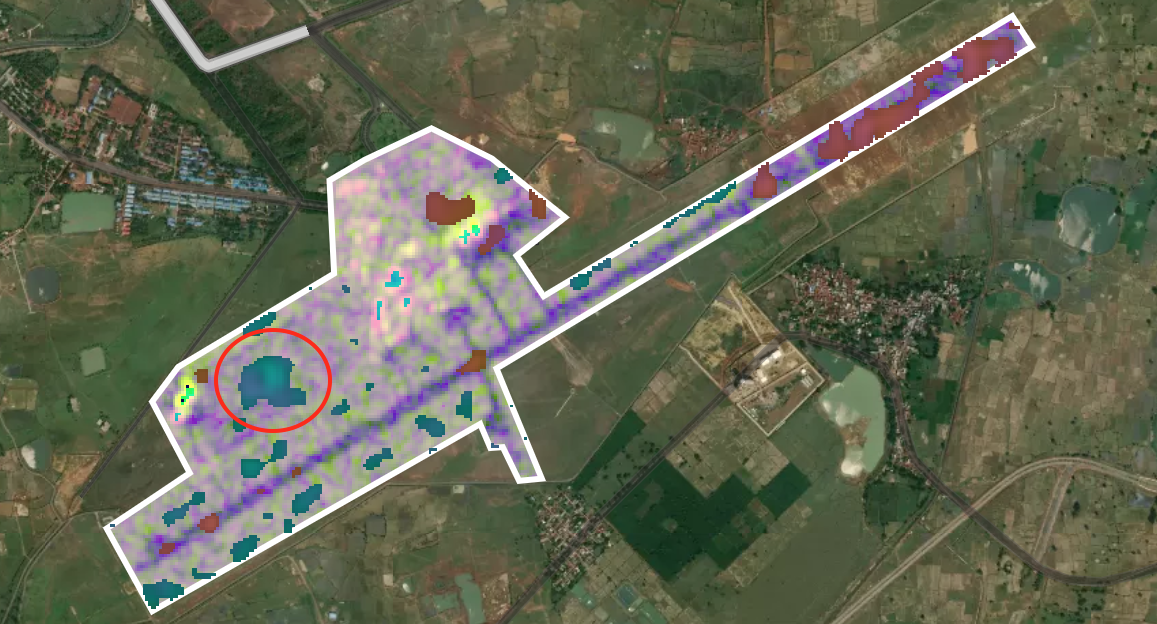
In the example above, we see that our algorithm is picking up changes in the vegetation adjacent to the runway (encircled in red), which likely have no relevance to the airport’s activity. Our algorithms feature adaptive settings that mitigate issues like these in most situations. However, the algorithm’s unsupervised nature means that there can be special cases where the approach can fail. Another typical example is the occurrence of construction at a location. The construction itself may not be a direct indicator of activity in that industry and is therefore considered disruptive to our signal.
Proper QA/QC is time-intensive, but the value it adds is worth the trouble. By making sure our database is comprehensive, precise, labeled, and includes locations that have been measured against ground truth, we ensure a high-quality product for our customers. As touched on before, our database is critical to the quality of our products, and therefore the success of our business. The colossal amount of data stored in it is consistent over time and gives our clients an edge over the competition. That is why we pay so much attention to all the details of the data we store in it.
Interested in digging further into SpaceKnow Nowcasting? Check here.
Get started at www.spaceknow.com, or reach out to us at info@spaceknow.com.